(그래픽·데이터 뉴스) 국가통계포털에 게재된 자료에 따르면, 지난해 자살(률)이 재작년 대비 눈에 띄게 증가한 것으로 나타났다.
국가통계포털(KOSIS)에 게재된 ‘사망원인별 사망자 수(고의적 자해)’ 데이터에 따르면, 지난해 자살자 수는 총 1만3661명인 것으로 잠정 집계됐다.
이는 재작년 자살자 수인 1만2906명보다 755명(약 5.8%)이나 증가한 수치다(아래 그래프 1 참고).
그래프 1. 우리나라 자살자 수 추이(단위: 명)

데이터: 통계청
주: 1) 2023년은 잠정치(P = Preliminary)
2) 데이터 정리 과정에 Human error가 포함됐을 수 있음
이를 성별로 구분해보면, 지난해 남성 자살자 수는 9558명으로 재작년 대비 539명(증가율로는 6.0%), 여성은 4103명으로 216명(증가율로는 5.6%) 증가했다(아래 그래프 2 참고).
그래프 2. 연도별 자살자 수 추이: 남 vs. 여(단위: 명)

데이터: 통계청
주: 1) 2023년은 잠정치(P = Preliminary)
2) 데이터 정리 과정에 Human error가 포함됐을 수 있음
이를 기준으로 산출한, 지난해 자살자 성비는 남성과 여성이 각각 7 대 3이다.
남녀 성비는 최근 2년간 소폭이지만 조금씩 벌어지는 추세다(아래 그래프 3 참고).
그래프 3. 자살자 성비 추이(단위: %)

데이터: 통계청
주: 1) 2023년은 잠정치(P = Preliminary)
2) 데이터 정리 과정에 Human error가 포함됐을 수 있음
인구 감소 시대에 ‘자살자 수 증가’는 곧 ‘인구 10만 명당 자살률’ 상승을 의미한다.
구체적으로 지난해 인구 십만 명당 자살률은 26.7명으로 재작년 25.2명보다 1.5명이나 증가했다.
이는 2018년 이후의 흐름과는 확실히 다른 움직임이다(아래 그래프 4 참고).
참고로 ‘인구 십만 명당 자살률’ 산출 시 사용되는 ‘연앙 인구(年央人口, Mid-year population, 해당 연도의 중간인 7월 1일자 인구, 그 연도를 대표하는 인구)’는 2022년 5125만9150명에서 2023년 5114만5885명으로 11만3265명이 감소했다.
그래프 4. 인구 10만 명당 자살률(단위: 명)

데이터: 통계청
주: 1) 2023년은 잠정치(P = Preliminary)
2) 데이터 정리 과정에 Human error가 포함됐을 수 있음
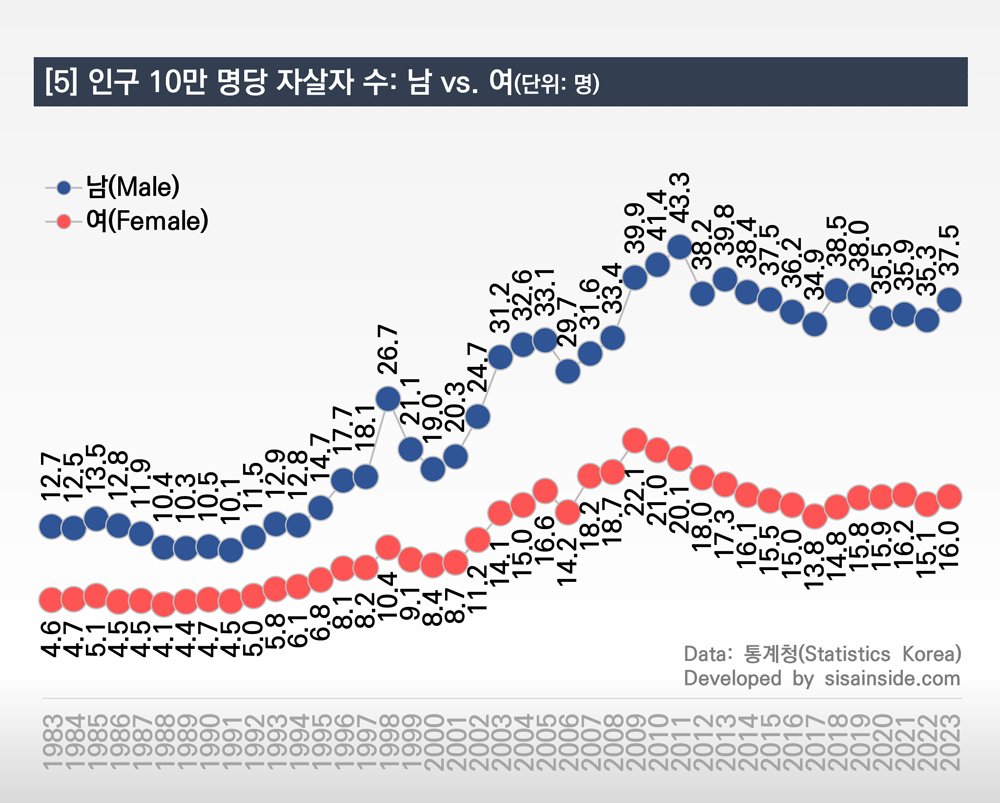
‘인구 10만 명당 자살자 수’를 성별로 구분해보면, 남성은 지난해 37.5명으로 재작년 35.3명보다 2.2명이 증가했고 여성은 지난해 16.0명으로 재작년 15.1명보다 0.9명 증가했다.
여성보다는 남성의 사망률이 2.5배 정도 더 크다(아래 그래프 5 참고).
그래프 5. 인구 10만 명당 자살률: 남 vs. 여(단위: 명)
데이터: 통계청
주: 1) 2023년은 잠정치(P = Preliminary)
2) 데이터 정리 과정에 Human error가 포함됐을 수 있음
지난해 남성 자살률이 크게 상승한 이유는 50대, 40대, 그리고 60대 자살자 수가 전년 대비 큰 폭으로 상승했기 때문이다(아래 그래프 6 참고).
50대와 40대의 자살자 수는, 2009년 가파른 상승 이후 2013년 고점을 찍고, 2014년부터 조금씩 하락세를 이어가다 지난해 다시 고개를 들었다.
그리고 60대 자살자 수는 2018년, 2019년 두 해 가파르게 상승한 뒤 3년간 잠시 안정세를 유지하다 지난해 다시 가파르게 상승했다.
그래프 6. 연령대별 자살자 수 추이: 남성(단위: 명)

데이터: 통계청
주: 1) 2023년은 잠정치(P = Preliminary)
2) 데이터 정리 과정에 Human error가 포함됐을 수 있음
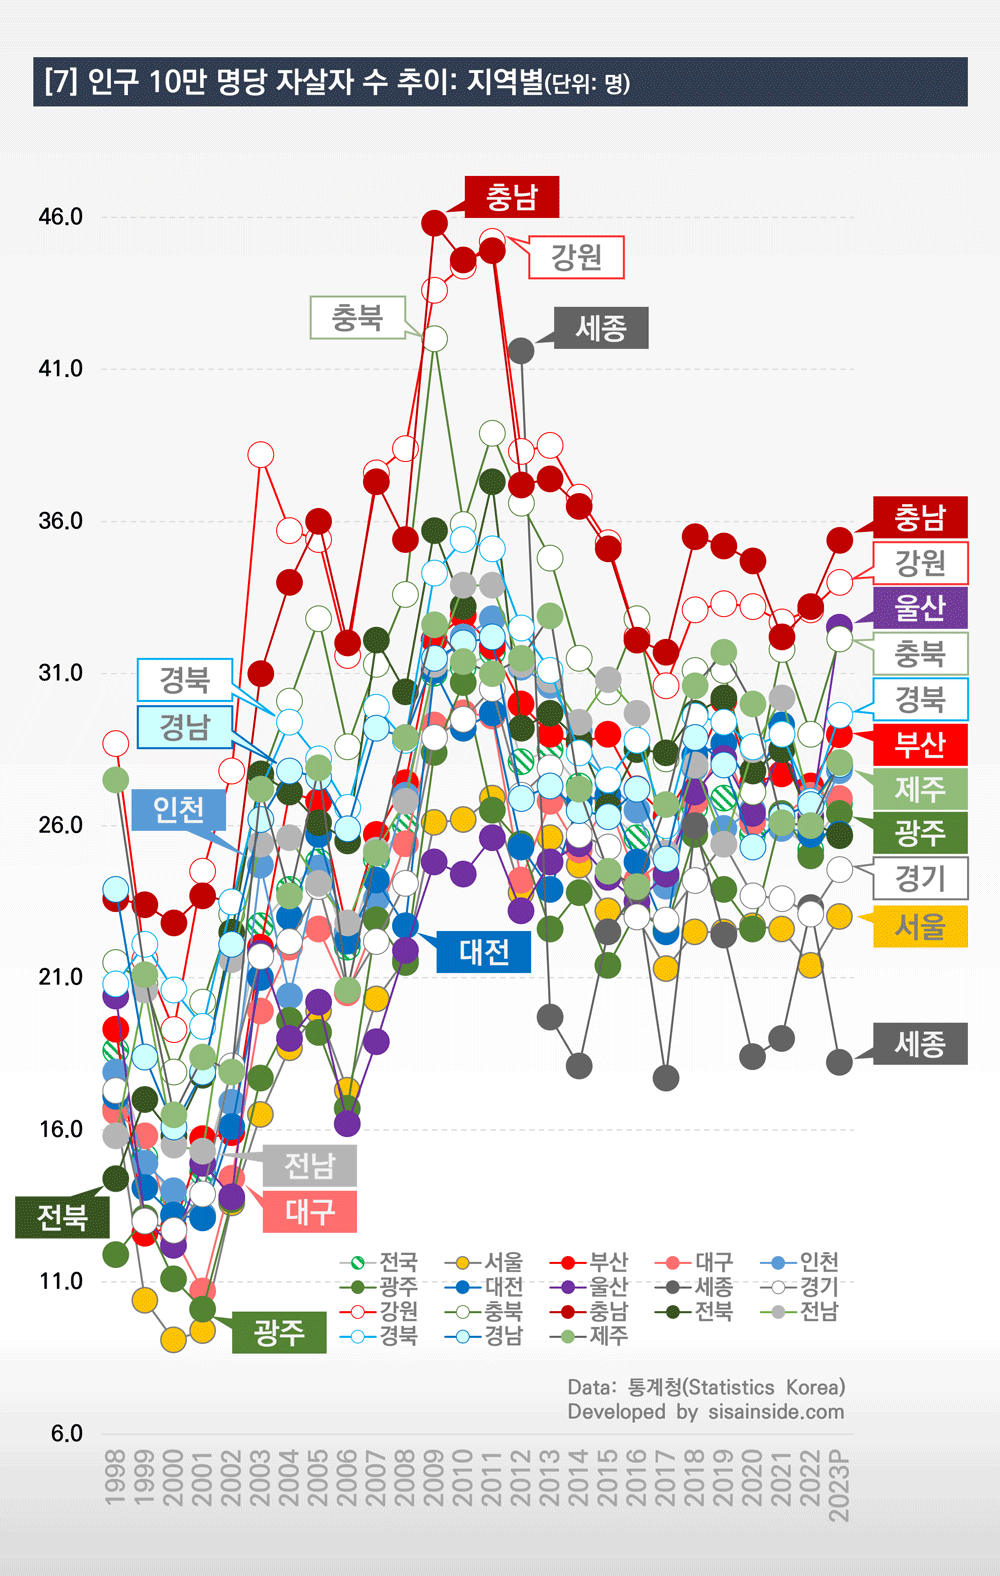
지난해 지역별 인구 10만 명당 자살률은 대구, 세종, 전북을 제외한 전 지역에서 재작년 대비 상승했다(자세한 내용은 아래 그래프 7과 표 1 참고).
지역별로는 충남과 강원이 여전히 다른 지역보다 높은 것으로 집계됐다.
그리고 안타깝게도 울산의 경우 지난해 인구 10만 명당 자살률이 재작년보다 6.2명이나 증가했다.
그래프 7. 지역별 인구 10만 명당 자살자 수 추이(단위: 명)
데이터: 통계청
주: 1) 2023년은 잠정치(P = Preliminary)
2) 데이터 정리 과정에 Human error가 포함됐을 수 있음
표 1. 인구 10만 명당 자살자 수 추이: 지역별(단위: 명)
| 구분 | 2019 | 2020 | 2021 | 2022(a) | 2023P(b) | 증감(b-a) | 순위(b) |
| 전국 | 26.9 | 25.7 | 26.0 | 25.2 | 26.7 | 1.5 | – |
| 서울 | 22.5 | 22.7 | 22.6 | 21.4 | 23.0 | 1.6 | 16 |
| 부산 | 30.1 | 27.4 | 27.7 | 27.3 | 29.0 | 1.7 | 6 |
| 대구 | 28.7 | 26.1 | 26.3 | 27.0 | 26.9 | -0.1 | 11 |
| 인천 | 25.9 | 26.5 | 25.9 | 25.8 | 27.8 | 2.0 | 10 |
| 광주 | 23.9 | 22.6 | 26.4 | 25.0 | 26.4 | 1.4 | 12 |
| 대전 | 28.7 | 27.2 | 29.3 | 25.7 | 25.7 | 0.0 | 13 |
| 울산 | 28.2 | 26.4 | 28.5 | 26.3 | 32.5 | 6.2 | 3 |
| 세종 | 22.4 | 18.4 | 19.0 | 23.3 | 18.2 | -5.1 | 17 |
| 경기 | 25.4 | 23.7 | 23.6 | 23.1 | 24.6 | 1.5 | 15 |
| 강원 | 33.3 | 33.2 | 32.7 | 33.1 | 34.0 | 0.9 | 2 |
| 충북 | 31.1 | 27.1 | 31.8 | 29.0 | 32.1 | 3.1 | 4 |
| 충남 | 35.2 | 34.7 | 32.2 | 33.2 | 35.4 | 2.2 | 1 |
| 전북 | 30.2 | 27.8 | 28.5 | 26.1 | 25.7 | -0.4 | 14 |
| 전남 | 25.4 | 28.5 | 30.2 | 26.6 | 28.0 | 1.4 | 9 |
| 경북 | 29.4 | 28.6 | 29.0 | 26.8 | 29.6 | 2.8 | 5 |
| 경남 | 28.0 | 25.3 | 26.3 | 26.7 | 28.0 | 1.3 | 8 |
| 제주 | 31.7 | 30.0 | 26.1 | 26.0 | 28.1 | 2.1 | 7 |
데이터: 통계청
주: 1) 2023년은 잠정치(P = Preliminary)
2) 데이터 정리 과정에 Human error가 포함됐을 수 있음
English version>>
Graphics and Data News: Suicide rate last year increased noticeably compared to the year before, Suicide rate trend 1983-2023P
(Graphic·Data News) According to data published on the KOSIS, the suicide rate last year increased noticeably compared to the year before.
According to the data on ‘Number of deaths by cause of death (intentional self-harm)’ published on the Korean Statistical Information Service (KOSIS), the number of suicides last year was tentatively calculated to be 13,661.
This is an increase of 755 people (approximately 5.8%) from the number of suicides the year before, which was 12,906 (see Graph 1 below).
Graph 1. Trends in the number of suicides in Korea (unit: people)
Breaking it down by gender, the number of male suicides last year was 9,558, an increase of 539 (6.0% increase), and 4,103 women, an increase of 216 (5.6% increase) compared to the previous year (see Graph 2 below).
Graph 2. Trends in the number of suicides by year: Male vs. Female (unit: person)
Calculated based on the above data, the sex ratio of suicides last year was 7 to 3 for men and women.
The gender ratio between men and women has been slightly increasing over the past two years (see Graph 3 below).
Graph 3. Trends in gender ratio of suicides (unit: %)
In an era of population decline, an increase in the number of suicides means an increase in the suicide rate per 100,000 people.
Specifically, the suicide rate per 100,000 people last year was 26.7, an increase of 1.5 from 25.2 the year before.
This is clearly a different movement from the trend since 2018 (see Graph 4 below).
For reference, the ‘mid-year population (population as of July 1, the middle of the year, population representing that year)’ used when calculating the ‘suicide rate per 100,000 population’ decreased by 113,265 from 51,259,150 in 2022 to 51,145,885 in 2023.
Graph 4. Suicide rate per 100,000 population (unit: people)
When dividing the ‘number of suicides per 100,000 population’ by gender, the number of men was 37.5 last year, an increase of 2.2 from 35.3 the year before, and the number of women was 16.0 last year, an increase of 0.9 from 15.1 the year before.
The suicide rate is approximately 2.5 times greater for men than for women (see Graph 5 below).
Graph 5. Suicide rate per 100,000 population: Male vs. Female (unit: person)
The reason why the male suicide rate increased significantly last year is because the number of suicides in their 50s, 40s, and 60s increased significantly compared to the previous year (see Graph 6 below).
The number of suicides in their 50s and 40s rose sharply in 2009, peaked in 2013, and continued to gradually decline from 2014, before rising again last year.
And the number of suicides in their 60s rose sharply in both 2018 and 2019, then remained stable for a while for three years before rising sharply again last year.
Graph 6. Trend in number of suicides by age group: Male (unit: people)
Last year, the suicide rate per 100,000 people by region increased compared to the year before last in all regions except Daegu, Sejong and Jeonbuk (see Graph 7 and Table 1 below for details).
By region, Chungnam-do and Gangwon are still higher than other regions.
And unfortunately, in the case of Ulsan, the suicide rate per 100,000 people last year increased by 6.2 compared to the year before.
Graph 7. Trends in the number of suicides per 100,000 people by region (unit: people)
Table 1. Trends in the number of suicides per 100,000 people by region (unit: people)
| Cls. | 2019 | 2020 | 2021 | 2022(a) | 2023P(b) | (b-a) | 2023 rank |
| Total | 26.9 | 25.7 | 26.0 | 25.2 | 26.7 | 1.5 | – |
| Seoul | 22.5 | 22.7 | 22.6 | 21.4 | 23.0 | 1.6 | 16 |
| Busan | 30.1 | 27.4 | 27.7 | 27.3 | 29.0 | 1.7 | 6 |
| Daegu | 28.7 | 26.1 | 26.3 | 27.0 | 26.9 | -0.1 | 11 |
| Incheon | 25.9 | 26.5 | 25.9 | 25.8 | 27.8 | 2.0 | 10 |
| Gwangju | 23.9 | 22.6 | 26.4 | 25.0 | 26.4 | 1.4 | 12 |
| Daejeon | 28.7 | 27.2 | 29.3 | 25.7 | 25.7 | 0.0 | 13 |
| Ulsan | 28.2 | 26.4 | 28.5 | 26.3 | 32.5 | 6.2 | 3 |
| Sejong | 22.4 | 18.4 | 19.0 | 23.3 | 18.2 | -5.1 | 17 |
| Gyeonggi | 25.4 | 23.7 | 23.6 | 23.1 | 24.6 | 1.5 | 15 |
| Gangwon | 33.3 | 33.2 | 32.7 | 33.1 | 34.0 | 0.9 | 2 |
| Chungbuk | 31.1 | 27.1 | 31.8 | 29.0 | 32.1 | 3.1 | 4 |
| Chungnam | 35.2 | 34.7 | 32.2 | 33.2 | 35.4 | 2.2 | 1 |
| Jeonbuk | 30.2 | 27.8 | 28.5 | 26.1 | 25.7 | -0.4 | 14 |
| Jeonnam | 25.4 | 28.5 | 30.2 | 26.6 | 28.0 | 1.4 | 9 |
| Gyeongbuk | 29.4 | 28.6 | 29.0 | 26.8 | 29.6 | 2.8 | 5 |
| Gyeongnam | 28.0 | 25.3 | 26.3 | 26.7 | 28.0 | 1.3 | 8 |
| Jeju | 31.7 | 30.0 | 26.1 | 26.0 | 28.1 | 2.1 | 7 |
Data: Statistics Korea
Note: 1) P = Preliminary
2) Human error may have been included in the data entry process.