(그래픽·데이터 뉴스) 2011년 이후 가파르게 하락하던 ‘혼인건수’는 이후 최근 2년간 횡보를, 그리고 ‘이혼건수’는 2004년 이후 완만한 하락세를 이어가고 있는 것으로 나타났다.
지난 19일 통계청이 발표한 ‘2023년 혼인·이혼 통계’에 따르면, 지난해 혼인건수는 2022년 대비 1,967건이 증가한 19만3657건으로 잠정 집계됐다(아래 표 1 참고).
이것만 보면 혼인건수가 앞으로 반등할 것처럼 보인다.
그러나, 이는 5년 전인 2019년 23만9159건과 비교할 경우 정확하게 45,502건이나 감소한 수치다.
장기적인 관점에서 혼인건수는 1996년 43만4911건을 정점으로 다소 가파른 하락세를 유지 중이다(아래 표 4, 그래프 2 참고).
그래서 이런 트렌드를 흔들 수 있는 외생변수(外生變數, Extraneous Variable)가 등장하지 않는 한 앞으로도 20만 건대를 돌파하기는 어려울 것으로 예상된다.
그리고, 혼인건수를 ‘인구 천명당’으로 환산한 ‘조(粗)혼인율’도 이와 유사한 추세다.
구체적으로 지난해 ‘조혼인율’은 2022년 대비 0.1건 증가했으나, 5년 전인 2019년 대비로는 0.9건이나 감소했다(표 1 참고).
표 1. 지난 5년간 혼인 및 조혼인율 추이(단위: 건)
| 구분 | 2019 | 2020 | 2021 | 2022 | 2023P | ||
| 전년 대비 | 2019 대비 | ||||||
| 혼인건수 | 239,159 | 213,502 | 192,507 | 191,690 | 193,657 | +1,967 | -45,502 |
| 조혼인율 | 4.7 | 4.2 | 3.8 | 3.7 | 3.8 | +0.1 | -0.9 |
데이터: 통계청
주: 1) 2023년은 잠정치(P = Preliminary)
2) 데이터 정리 과정에 Human error가 포함됐을 수 있음
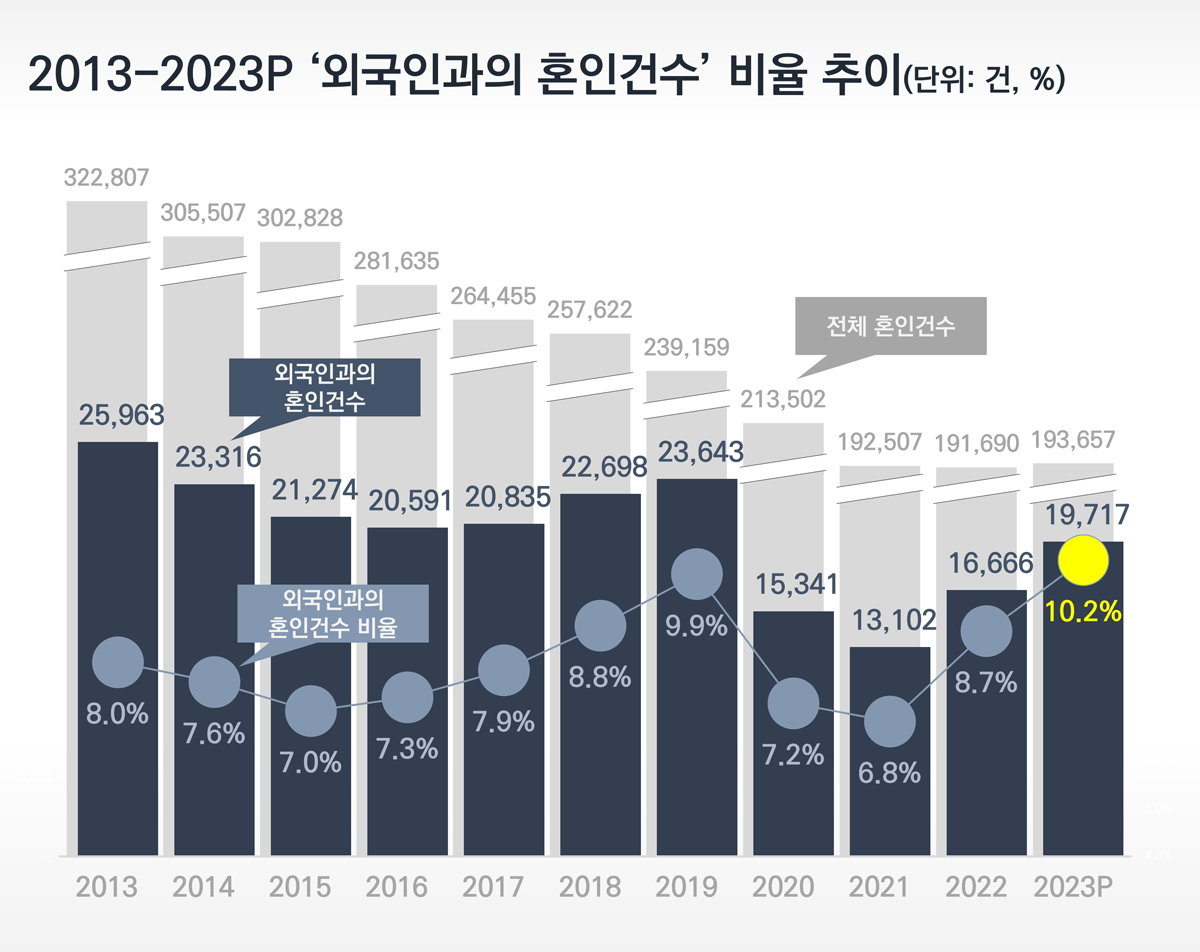
이번 혼인 통계에서 특이할 만한 점은, 내국인의, ‘외국인과의 혼인건수’가 코로나19 이전 상황으로 빠르게 회복하고 있다는 것이다.
특히, 지난해 ‘전체 혼인건수’ 중 ‘외국인과의 혼인건수’의 점유율은 10.2%나 됐다.
이는 2011년 이후 최고치다.
그래프 1. 외국인과의 혼인건수 및 점유율 추이(단위: 건, %)
데이터: 통계청
주: 1) 2023년은 잠정치(P = Preliminary)
2) 데이터 정리 과정에 Human error가 포함됐을 수 있음
지난해 내국인 남녀의 ‘외국인과의 혼인건수’는 각각 1만4710건, 5007건이다.
이는 전년 대비 각각 2703건(+22.5%), 348건(+7.5%) 증가한 수치다.
표 2. 내국인 남녀의 ‘외국인과의 혼인건수’ 추이(단위: 명, %)
| 구분 | 2019 | 2020 | 2021 | 2022 | 2023P | ||
| 전년 대비 | 2019 대비 | ||||||
| 외국인과의 혼인건수(a) | 23,643 | 15,341 | 13,102 | 16,666 | 19,717 | +3,051 | -3,926 |
| 한국男+ 외국女(b) |
17,687 | 11,100 | 8,985 | 12,007 | 14,710 | +2,703 (+22.5%) |
-2,977 |
| b/a% | 74.8% | 72.4% | 68.6% | 72.0% | 74.6% | +2.6%p | -0.2%p |
| 한국女+ 외국男(c) |
5,956 | 4,241 | 4,117 | 4,659 | 5,007 | +348 (+7.5%) |
-949 |
| c/a% | 25.2% | 27.6% | 31.4% | 28.0% | 25.4% | -2.6%p | +0.2%p |
데이터: 통계청
주: 1) 2023년은 잠정치(P = Preliminary)
2) 데이터 정리 과정에 Human error가 포함됐을 수 있음
한편, 지난해 이혼건수는 2022년 대비 838건이 감소한 9만2394건으로 잠정 집계됐다.
이는 5년 전인 2019년 11만831건과 비교할 경우 18,437건이나 감소한 수치다.
장기적인 관점에서 이혼건수는 2003년 16만6617건을 정점으로 꾸준하게 감소하고 있다(표 4, 그래프 2 참고).
그리고 이를 ‘인구 천명당’으로 환산한 ‘조(粗)이혼율’도 이와 유사한 추세다.
구체적으로 지난해 ‘조이혼율’은 1.8건으로 2022년과 유사한 수준으로 집계됐으나, 2019년 대비로는 0.4건이나 감소했다.
표 3. 지난 5년간 이혼건수 및 조이혼율 추이(단위: 건)
| 구분 | 2019 | 2020 | 2021 | 2022 | 2023P | ||
| 전년 대비 | 2019 대비 | ||||||
| 이혼건수 | 110,831 | 106,500 | 101,673 | 93,232 | 92,394 | -838 | -18,437 |
| 조이혼율 | 2.2 | 2.1 | 2.0 | 1.8 | 1.8 | 0.0 | -0.4 |
데이터: 통계청
주: 1) 2023년은 잠정치(P = Preliminary)
2) 데이터 정리 과정에 Human error가 포함됐을 수 있음
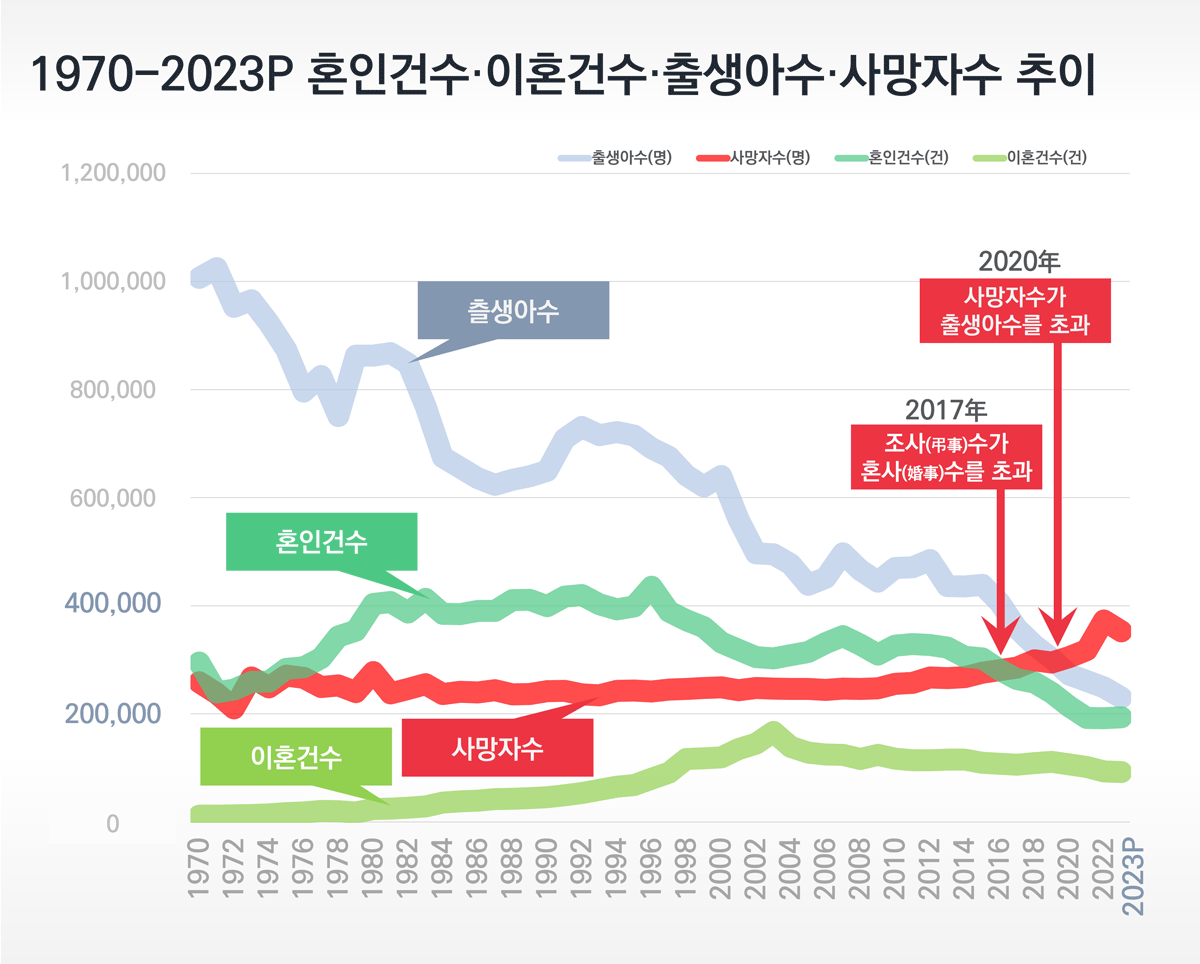
이하 ‘혼인건수’와 ‘이혼건수’에 ‘출생아수’와 ‘사망자수’를 추가한 그래프를 붙여 드린다.
참고로, 2017년은 조사(弔事)수가 혼사(婚事)수를, 2020년은 사망자수가 출생아수를 넘어선 해다.
우리나라 대한민국은 우리의 생각보다 훨씬 더 빠른 속도로 쇠퇴하고 있는 중이다.
그래프 2. 1970-2023P 혼인건수·이혼건수·출생아수·사망자수 추이(단위: 명, 건)
데이터: 통계청
주: 1) 2023년은 잠정치(P = Preliminary)
2) 2022년 급증했던 사망률이 2023년 정상 궤도(추세)로 복귀한 것으로 추정
3) 데이터 정리 과정에 Human error가 포함됐을 수 있음
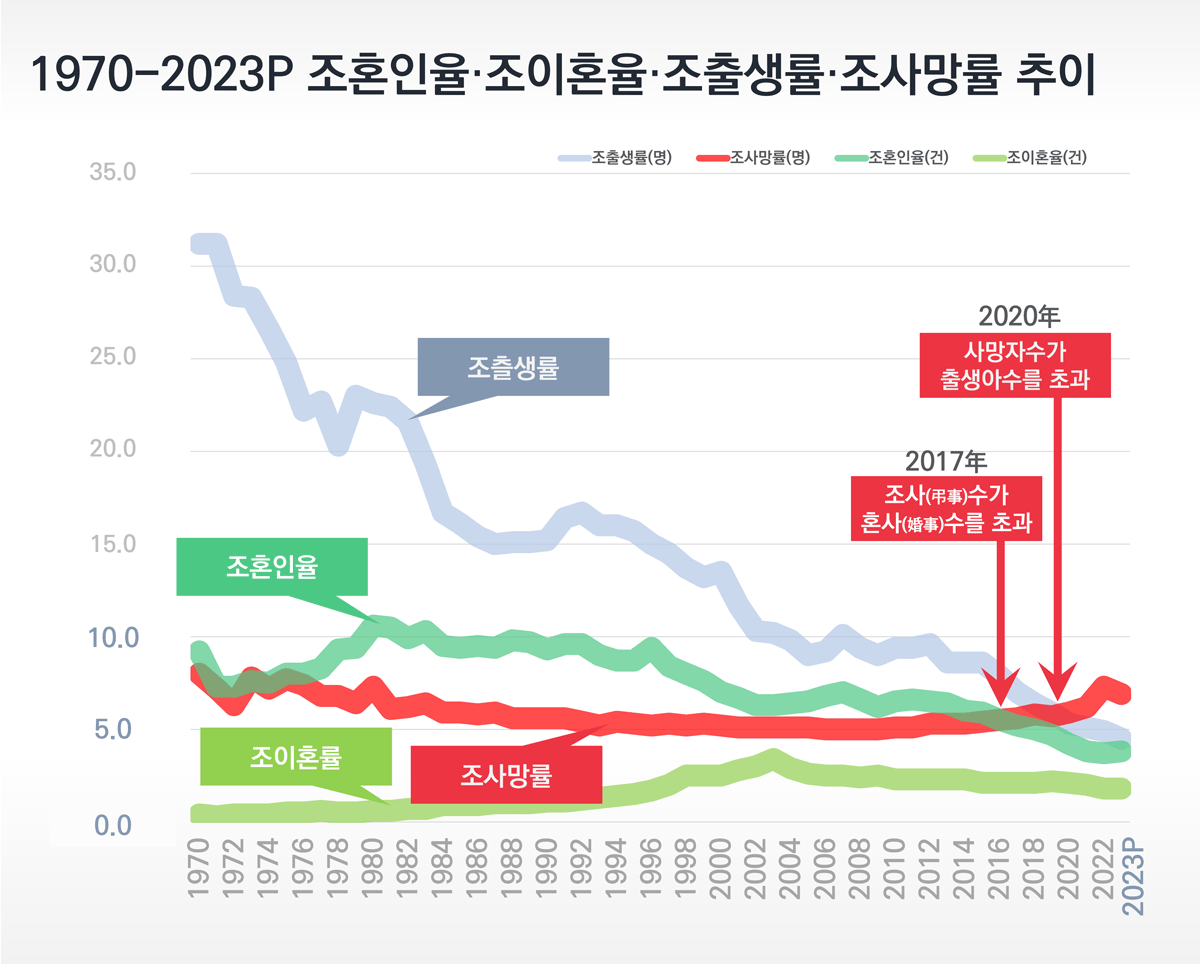
그래프 3. 1970-2023P 조혼인율·조이혼율·조출생률·조사망률 추이(단위: 명, 건)
데이터: 통계청
주: 1) 2023년은 잠정치(P = Preliminary)
2) 2022년 급증했던 사망률이 2023년 정상 궤도(추세)로 복귀한 것으로 추정
3) 데이터 정리 과정에 Human error가 포함됐을 수 있음
표 4. 1970-2023P 혼인·조혼인율, 이혼·조이혼율, 출생·조출생률, 사망·조사망률 추이(단위: 건, 명)
| 연도 | 혼인건수 (명) |
조혼인율 (천명당) |
이혼건수 (명) |
조이혼율 (천명당) |
출생아수 (명) |
조출생률 (천명당) |
사망자수 (명) |
조사망률 (천명당) |
| 1970 | 295,137 | 9.2 | 11,615 | 0.4 | 1,006,645 | 31.2 | 258,589 | 8.0 |
| 1971 | 239,457 | 7.3 | 11,361 | 0.3 | 1,024,773 | 31.2 | 237,528 | 7.2 |
| 1972 | 244,780 | 7.3 | 12,188 | 0.4 | 952,780 | 28.4 | 210,071 | 6.3 |
| 1973 | 259,112 | 7.6 | 12,719 | 0.4 | 965,521 | 28.3 | 267,460 | 7.8 |
| 1974 | 259,604 | 7.5 | 14,073 | 0.4 | 922,823 | 26.6 | 248,807 | 7.2 |
| 1975 | 283,226 | 8.0 | 16,453 | 0.5 | 874,030 | 24.8 | 270,657 | 7.7 |
| 1976 | 285,910 | 8.0 | 17,178 | 0.5 | 796,331 | 22.2 | 266,857 | 7.4 |
| 1977 | 303,156 | 8.3 | 20,280 | 0.6 | 825,339 | 22.7 | 249,254 | 6.8 |
| 1978 | 343,013 | 9.3 | 19,734 | 0.5 | 750,728 | 20.3 | 252,298 | 6.8 |
| 1979 | 353,824 | 9.4 | 17,178 | 0.5 | 862,669 | 23.0 | 239,986 | 6.4 |
| 1980 | 403,031 | 10.6 | 23,662 | 0.6 | 862,835 | 22.6 | 277,284 | 7.3 |
| 1981 | 406,795 | 10.5 | 24,278 | 0.6 | 867,409 | 22.4 | 237,481 | 6.1 |
| 1982 | 387,468 | 9.9 | 26,124 | 0.7 | 848,312 | 21.6 | 245,767 | 6.2 |
| 1983 | 412,984 | 10.3 | 28,549 | 0.7 | 769,155 | 19.3 | 254,563 | 6.4 |
| 1984 | 385,188 | 9.5 | 35,772 | 0.9 | 674,793 | 16.7 | 236,445 | 5.9 |
| 1985 | 384,686 | 9.4 | 38,187 | 0.9 | 655,489 | 16.1 | 240,418 | 5.9 |
| 1986 | 390,229 | 9.5 | 39,132 | 0.9 | 636,019 | 15.4 | 239,256 | 5.8 |
| 1987 | 390,276 | 9.4 | 42,268 | 1.0 | 623,831 | 15.0 | 243,504 | 5.9 |
| 1988 | 410,129 | 9.8 | 42,757 | 1.0 | 633,092 | 15.1 | 235,779 | 5.6 |
| 1989 | 410,708 | 9.7 | 44,017 | 1.0 | 639,431 | 15.1 | 236,818 | 5.6 |
| 1990 | 399,312 | 9.3 | 45,694 | 1.1 | 649,738 | 15.2 | 241,616 | 5.6 |
| 1991 | 416,872 | 9.6 | 49,205 | 1.1 | 709,275 | 16.4 | 242,270 | 5.6 |
| 1992 | 419,774 | 9.6 | 53,539 | 1.2 | 730,678 | 16.7 | 236,162 | 5.4 |
| 1993 | 402,593 | 9.0 | 59,313 | 1.3 | 715,826 | 16.0 | 234,257 | 5.2 |
| 1994 | 393,121 | 8.7 | 65,015 | 1.4 | 721,185 | 16.0 | 242,439 | 5.4 |
| 1995 | 398,484 | 8.7 | 68,279 | 1.5 | 715,020 | 15.7 | 242,838 | 5.3 |
| 1996 | 434,911 | 9.4 | 79,895 | 1.7 | 691,226 | 15.0 | 241,149 | 5.2 |
| 1997 | 388,960 | 8.4 | 91,160 | 2.0 | 675,394 | 14.5 | 244,693 | 5.3 |
| 1998 | 373,500 | 8.0 | 116,294 | 2.5 | 641,594 | 13.7 | 245,825 | 5.2 |
| 1999 | 360,407 | 7.6 | 117,449 | 2.5 | 620,668 | 13.2 | 247,734 | 5.3 |
| 2000 | 332,090 | 7.0 | 119,455 | 2.5 | 640,089 | 13.5 | 248,740 | 5.2 |
| 2001 | 318,407 | 6.7 | 134,608 | 2.8 | 559,934 | 11.7 | 243,813 | 5.1 |
| 2002 | 304,877 | 6.3 | 144,910 | 3.0 | 496,911 | 10.3 | 247,524 | 5.1 |
| 2003 | 302,503 | 6.3 | 166,617 | 3.4 | 495,036 | 10.2 | 246,463 | 5.1 |
| 2004 | 308,598 | 6.4 | 138,932 | 2.9 | 476,958 | 9.8 | 246,220 | 5.1 |
| 2005 | 314,304 | 6.5 | 128,035 | 2.6 | 438,707 | 9.0 | 245,874 | 5.1 |
| 2006 | 330,634 | 6.8 | 124,524 | 2.5 | 451,759 | 9.2 | 244,162 | 5.0 |
| 2007 | 343,559 | 7.0 | 124,072 | 2.5 | 496,822 | 10.1 | 246,482 | 5.0 |
| 2008 | 327,715 | 6.6 | 116,535 | 2.4 | 465,892 | 9.4 | 246,113 | 5.0 |
| 2009 | 309,759 | 6.2 | 123,999 | 2.5 | 444,849 | 9.0 | 246,942 | 5.0 |
| 2010 | 326,104 | 6.5 | 116,858 | 2.3 | 470,171 | 9.4 | 255,405 | 5.1 |
| 2011 | 329,087 | 6.6 | 114,284 | 2.3 | 471,265 | 9.4 | 257,396 | 5.1 |
| 2012 | 327,073 | 6.5 | 114,316 | 2.3 | 484,550 | 9.6 | 267,221 | 5.3 |
| 2013 | 322,807 | 6.4 | 115,292 | 2.3 | 436,455 | 8.6 | 266,257 | 5.3 |
| 2014 | 305,507 | 6.0 | 115,510 | 2.3 | 435,435 | 8.6 | 267,692 | 5.3 |
| 2015 | 302,828 | 5.9 | 109,153 | 2.1 | 438,420 | 8.6 | 275,895 | 5.4 |
| 2016 | 281,635 | 5.5 | 107,328 | 2.1 | 406,243 | 7.9 | 280,827 | 5.5 |
| 2017 | 264,455 | 5.2 | 106,032 | 2.1 | 357,771 | 7.0 | 285,534 | 5.6 |
| 2018 | 257,622 | 5.0 | 108,684 | 2.1 | 326,822 | 6.4 | 298,820 | 5.8 |
| 2019 | 239,159 | 4.7 | 110,831 | 2.2 | 302,676 | 5.9 | 295,110 | 5.7 |
| 2020 | 213,502 | 4.2 | 106,500 | 2.1 | 272,337 | 5.3 | 304,948 | 5.9 |
| 2021 | 192,507 | 3.8 | 101,673 | 2.0 | 260,562 | 5.1 | 317,680 | 6.2 |
| 2022 | 191,690 | 3.7 | 93,232 | 1.8 | 249,186 | 4.9 | 372,939 | 7.3 |
| 2023P | 193,657 | 3.8 | 92,394 | 1.8 | 230,000 | 4.5 | 352,700 | 6.9 |
데이터: 통계청
주: 1) 2023년은 잠정치(P = Preliminary)
2) 위 ‘천명당’은 인구 1천 명당을 의미
3) 데이터 정리 과정에 Human error가 포함됐을 수 있음
English Version>>
Graphics and Data News: Recently, the number of marriages has declined and then remained flat, the number of divorces is gradually decreasing, the number of births is rapidly falling, and the number of deaths is on the rise.
(Graphic·Data News) The ‘number of marriages’, which had been falling steeply since 2011, has been trending sideways for the past two years, and the ‘number of divorces’ has been continuing a gradual decline since 2004.
According to the ‘2023 Marriage and Divorce Statistics’ released by Statistics Korea on the 19th, the number of marriages in 2023 was provisionally calculated to be 193,657, an increase of 1,967 compared to 2022 (see Table 1 below).
Looking at this alone, it looks like the number of marriages will rebound in the future.
However, this is a decrease of exactly 45,502 cases compared to 239,159 cases in 2019, five years ago.
From a long-term perspective, the number of marriages has maintained a rather steep decline since its peak of 434,911 in 1996 (see Table 4 and Graph 2 below).
Therefore, unless an exogenous variable appears that can shake up this trend, it is expected that it will be difficult to exceed the 200,000 level in the future.
Also, the ‘crude marriage rate (CMR)’, which converts the number of marriages into ‘per thousand population’, showed a similar trend.
Specifically, last year’s ‘crude marriage rate’ increased by 0.1 cases compared to 2022, but decreased by 0.9 cases compared to 2019, five years ago (see Table 1).
Table 1. Trends in marriage and crude marriage rates over the past five years (unit: cases)
| Cls. | 2019 | 2020 | 2021 | 2022 | 2023P | ||
| YOY | vs. 2019 | ||||||
| no. of marriage | 239,159 | 213,502 | 192,507 | 191,690 | 193,657 | +1,967 | -45,502 |
| CMR | 4.7 | 4.2 | 3.8 | 3.7 | 3.8 | +0.1 | -0.9 |
Data: Statistics Korea
Note: 1) 2023P = Preliminary figures
2) Human error may have been included in the data entry process.
What is unique about these marriage statistics is that the number of marriages between Koreans and foreigners is rapidly recovering to the pre-COVID-19 situation.
In particular, the share of ‘number of marriages with foreigners’ among the ‘total number of marriages’ last year was 10.2%.
This is the highest since 2011.
Graph 1. Number and share of marriages with foreigners (unit: cases, %)
Data: Statistics Korea
Note: 1) 2023P = Preliminary figures
2) Human error may have been included in the data entry process.
Last year, the number of marriages between Korean men and women with foreigners was 14,710 and 5,007, respectively.
This is an increase of 2703 cases (+22.5%) and 348 cases (+7.5%), respectively, compared to the previous year.
Table 2. Trends in “number of marriages with foreigners” by Korean men and women (unit: number of marriages, %)
| Cls. | 2019 | 2020 | 2021 | 2022 | 2023P | ||
| YOY | vs. 2019 | ||||||
| No. of marriages w/ foreigners(a) | 23,643 | 15,341 | 13,102 | 16,666 | 19,717 | +3,051 | -3,926 |
| Korean Man+ Foreign Woman(b) |
17,687 | 11,100 | 8,985 | 12,007 | 14,710 | +2,703 (+22.5%) |
-2,977 |
| b/a% | 74.8% | 72.4% | 68.6% | 72.0% | 74.6% | +2.6%p | -0.2%p |
| Korean Woman+ Foreign Man(c) |
5,956 | 4,241 | 4,117 | 4,659 | 5,007 | +348 (+7.5%) |
-949 |
| c/a% | 25.2% | 27.6% | 31.4% | 28.0% | 25.4% | -2.6%p | +0.2%p |
Data: Statistics Korea
Note: 1) 2023P = Preliminary figures
2) Human error may have been included in the data entry process.
Meanwhile, the number of divorces last year was provisionally calculated to be 92,394, a decrease of 838 cases compared to 2022.
This is a decrease of 18,437 cases compared to 110,831 cases in 2019, five years ago.
From a long-term perspective, the number of divorces has been steadily decreasing since its peak of 166,617 in 2003 (see Table 4 and Graph 2).
And the ‘crude divorce rate (CDR)’, which is converted to ‘per thousand population’, shows a similar trend.
Specifically, last year’s ‘crude divorce rate’ was 1.8, similar to 2022, but decreased by 0.4 compared to 2019.
Table 3. Trends in number of divorces and crude divorce rate over the past five years (unit: cases)
| Cls. | 2019 | 2020 | 2021 | 2022 | 2023P | ||
| YOY | vs. 2019 | ||||||
| No. of Divorce | 110,831 | 106,500 | 101,673 | 93,232 | 92,394 | -838 | -18,437 |
| CDR | 2.2 | 2.1 | 2.0 | 1.8 | 1.8 | 0.0 | -0.4 |
Data: Statistics Korea
Note: 1) 2023P = Preliminary figures
2) Human error may have been included in the data entry process.
Below, we attach a graph that adds ‘number of births’ and ‘number of deaths’ to the ‘number of marriages’ and ‘number of divorces.’
For reference, in 2017, the number of deaths exceeded the number of marriages, and in 2020, the number of deaths exceeded the number of births.
Our country, the Republic of Korea, is declining at a much faster rate than we thought.
Graph 2. Trends in the number of marriages, divorces, births, and deaths from 1970 to 2023 (unit: people, cases)
Data: Statistics Korea
Note: 1) 2023P = Preliminary figures
2) It is estimated that the death rate, which surged in 2022, has returned to the normal track (trend) in 2023.
3) Human error may have been included in the data entry process.
Graph 3. Trends in crude marriage rate, crude divorce rate, crude birth rate, and crude death rate from 1970 to 2023P (unit: people, cases)
Footnotes and sources are the same as above.
Table 4. Trends in marriage #/crude marriage rate, divorce #/crude divorce rate, birth #/crude birth rate, and death #/crude mortality rate from 1970 to 2023 (unit: cases, people)
Data: Statistics Korea
Note: 1) 2023P = Preliminary figures
2) ‘Per 1,000 people’ above means per 1,000 population.
3) Human error may have been included in the data entry process.