(그래픽·데이터 뉴스) 2023년 결산 기준, 국가채무는 1126.7조원으로 사상 最古値(최고치)를 기록했다.
4·10 총선 다음날인, 지난 11일 국무회의에서 심의·의결한 ‘2023 회계연도 국가 결산보고서‘에 따르면, 지난해 우리나라의 국가채무(國家債務, Government Debt)는, 2022년보다 59.4조원 증가한, 1126.7조원으로 사상 최고치를 기록했다(그래프 1, 표 1 참고).
이는 2023년 GDP(명목 기준 2236.3조원) 대비 50.4%에 달하는 수치이며 이 또한 역대 최고치다.
그래프 1. 역대 정부별 국가채무 추이(단위: 조원, %)
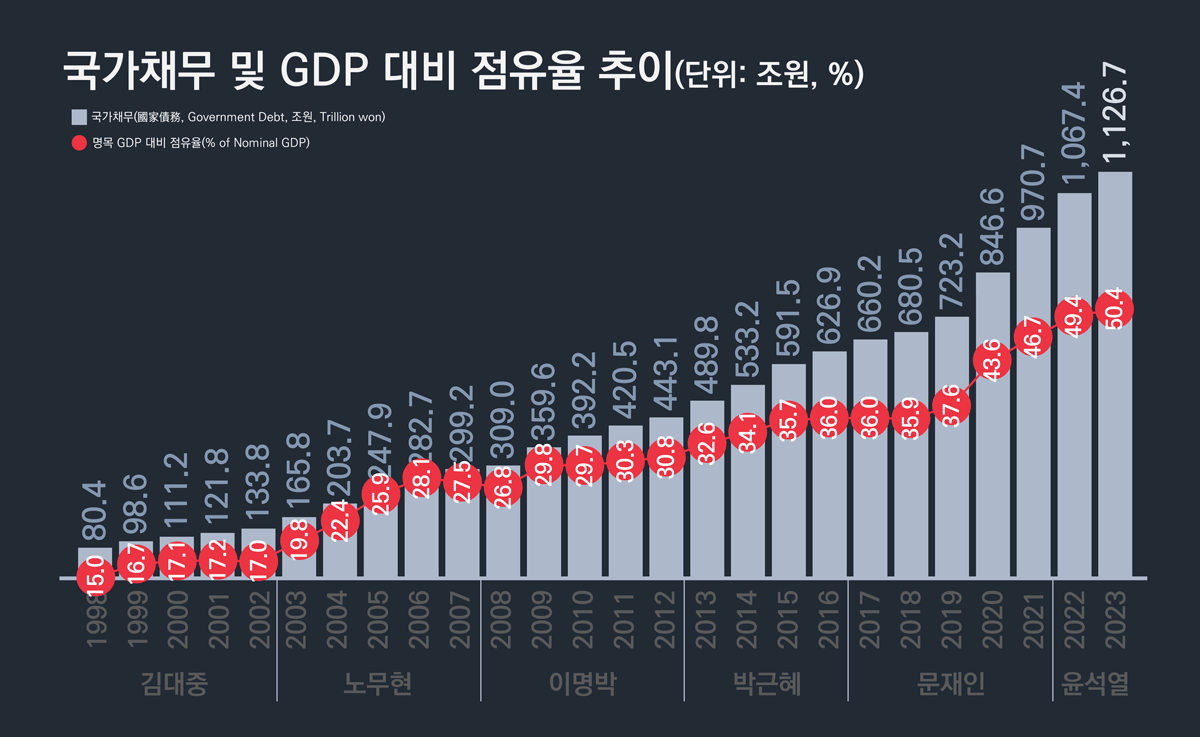
데이터: 기획재정부, KOSIS
주: 1) 대통령 임기 구분은 연도末 기준
2) 2023년 데이터는 잠정치
3) 데이터 정리 과정에 Human error가 포함됐을 수 있음
전체 국가채무 중 ‘중앙정부 채무’는 1092.5조원으로 전년 보다 59.1조원 증가했으며 이를 견인한 것은 ‘국고채’였다(표 1 참고).
국고채 잔액이 2022년 대비 60.5조원이나 증가했기 때문이다.
정부 보고서에 따르면, 이는 주로 ‘일반회계 적자 보전(54.3조원)’ 목적이었던 것으로 추정된다.
반면, 국민주택채권, 외국환평형기금채권, 그리고 차입금은 2022년보다 각각 약 5천억원, 3천억원, 7천억원씩 감소했다.
표 1. 2023 회계연도 국가채무 결산 요약(단위: 조원, %, %p)
| 구분 | ’22년 결산 (A) |
’23년 | 증감 | ||
| 예산(B) | 결산(잠정) | A 對比 | B 對比 | ||
| 국가채무 (①+②) | 1,067.40 | 1,134.40 | 1,126.70 | 59.4 | △7.6 |
| (GDP대비, %) | (49.4) | (50.4) | (50.4) | (1.0%p) | (△0.1%p) |
| ① 중앙정부 채무 | 1,033.40 | 1,101.70 | 1,092.50 | 59.1 | △9.2 |
| – 국채 | 1,031.50 | 1,100.30 | 1,091.10 | 59.6 | △9.2 |
| (국고채) | 937.5 | 999 | 998 | 60.5 | △1.0 |
| (국민주택채권) | 82.2 | 86.8 | 81.6 | △0.5 | △5.2 |
| (외국환평형기금채권) | 11.8 | 14.5 | 11.5 | △0.3 | △3.1 |
| – 차입금 | 1.9 | 1.2 | 1.2 | △0.7 | – |
| – 국고채무부담행위 | 0.1 | 0.2 | 0.2 | 0.1 | – |
| ② 지방정부 순채무2 | 33.9 | 32.6 | 34.2 | 0.3 | 1.6 |
데이터: 기획재정부
주: 1) △은 음수(negative number)를 의미
2) 지방정부 순채무는 전체 채무 중 중앙정부에 대한 채무를 제외한 값
3) 데이터 정리 과정에 Human error가 포함됐을 수 있음
국가채무 증가율(전년 대비)은 2020년을 정점(코로나19 대응사업)으로 3년 연속, GDP 성장률(명목과 실질 모두)은 2021년을 정점으로 2년 연속 하락했다(그래프 2 참고).
참고로, 국가채무 증감률과 GDP 성장률의 장기 추이를 보면 국가채무의 증가가 GDP 성장률를 견인하는 것처럼 보이나 국가채무의 용처(用處)에 따라 결과(방향과 크기)는 달라질 수 있다.
그래프 2. 성장률 추이: GDP vs. 국가채무(단위: %)
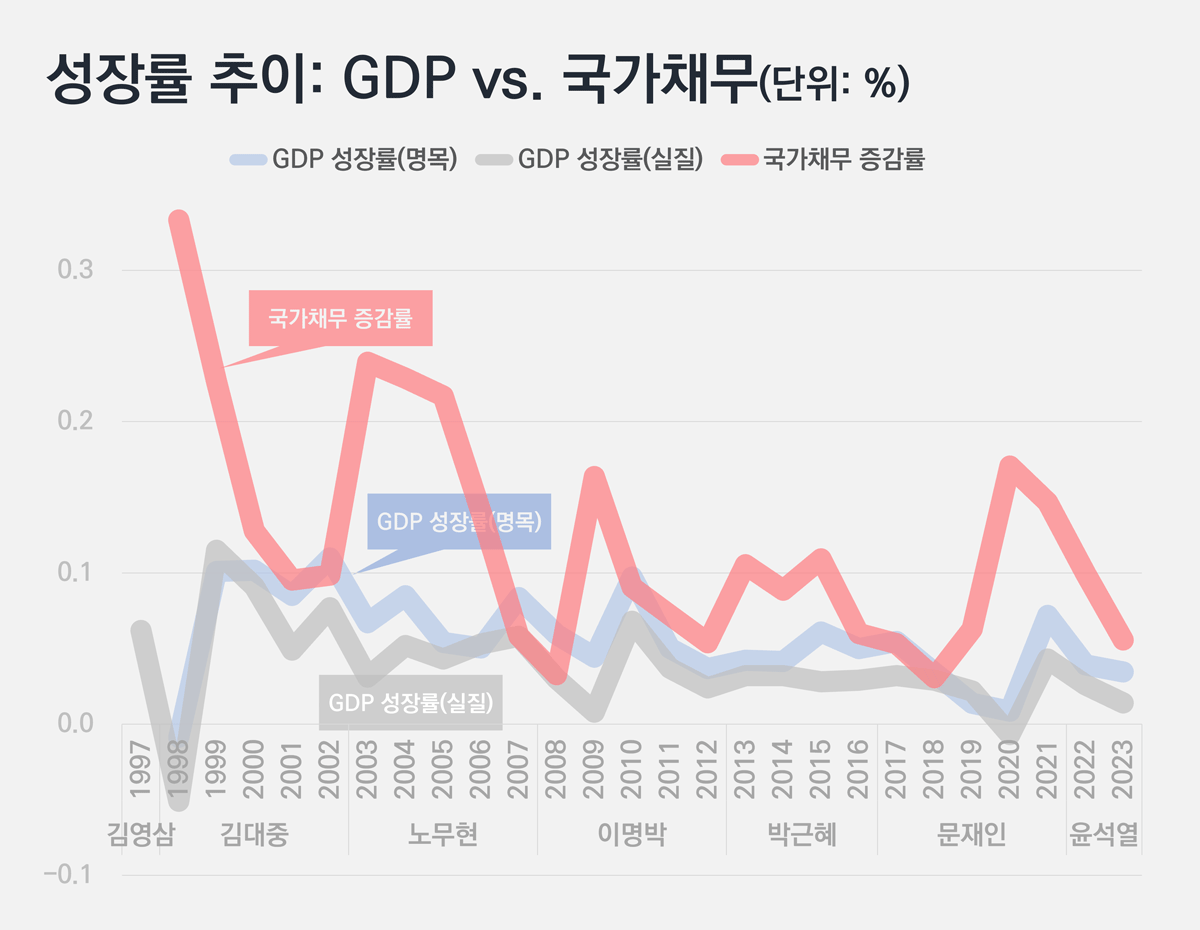
데이터: 기획재정부, KOSIS
주: 1) 대통령 임기 구분은 연도末 기준
2) 성장률은 각 항목別 전년 대비 증감률(YOY%)
3) 데이터 정리 과정에 Human error가 포함됐을 수 있음
4) 상세 데이터는 아래 표 3 참고
한편 지난해 통합재정수지(총수입에서 총지출을 뺀 금액)는 -36.8조원으로 2019년 이후 5년 연속 적자를 기록했다(표 2, 4, 그래프 3 참고).
지난해 총지출은 전년 대비 71.7조원이 감소했지만(코로나 대응사업 축소, 지방교부세 감소 등), 총수입도 43.9조원이나 감소(법인세·소득세·부가가치세, 양도소득세 등)했다.
특히 총수입은 지난해 예산(계획)보다 51.8조원이나 적었다.
그래서 통합재정수지 적자가 2022년 보다 27.8조원 감소했지만 2023년 예산(계획) 보다 23.7조원이나 증가했다.
그리고 이런 현상은 관리재정수지에도 그대로 반영됐다.
즉 관리재정수지가 2022년 보다 30.0조원이 감소했지만, 2023년 예산(계획) 보다 28.8조원이나 증가한 것이다.
그래서 재정건전성 강조하며 前 정부와의 차별화를 시도했던 윤석열 정부의 기준(재정준칙에서 제시한 GDP 대비 관리재정수지 점유율 ‘3.0% 이내’)이 0.9%p나 초과됐다.
참고로 총수입과 총지출이 감소한 것은 2005년 총수입과 총지출의 개념을 도입한 이후 처음 있는 일이다.
표 2. 2023 회계연도 중앙정부 재정수지 결산 요약(단위: 조원, %, %p)
| 구분 | ’22년 결산 (A) |
’23년 | 증감 | ||
| 예산(B) | 결산(잠정) | A 對比 | B 對比 | ||
| 총수입(A) | 617.8 | 625.7 | 573.9 | △43.9 | △51.8 |
| 총지출(B) | 682.4 | 638.7 | 610.7 | △71.7 | △28.0 |
| 통합재정수지(C, A-B) | △64.6 | △13.1 | △36.8 | 27.8 | △23.7 |
| (GDP 대비, %) | (△3.0) | (△0.6) | (△1.6) | (1.3%p) | (△1.1%p) |
| 사회보장성기금수지(D) | 52.5 | 45.1 | 50.3 | △2.2 | 5.1 |
| 관리재정수지(E, C-D) | △117.0 | △58.2 | △87.0 | 30.0 | △28.8 |
| (GDP 대비, %) | (△5.4) | (△2.6) | (△3.9) | (1.5%p) | (△1.3%p) |
데이터: 기획재정부
주: 1) △은 음수(negative number)를 의미
2) 명목 GDP(2024.3.5. 한은 발표 기준) → (’22년) 2,161.8조원/(’23년) 2,236.3조원(잠정치)
3) 데이터 정리 과정에 Human error가 포함됐을 수 있음
중장기적 시각에서, 통합재정수지(1970년 이후)와 관리재정수지(1990년 이후) 추이를 살펴보면 최근 몇 년간의 재정수지 움직임은 매우 불안정한 상태로 해석된다.
그래프 3. 통합재정수지 vs. 관리재정수지 추이(단위: 조원)
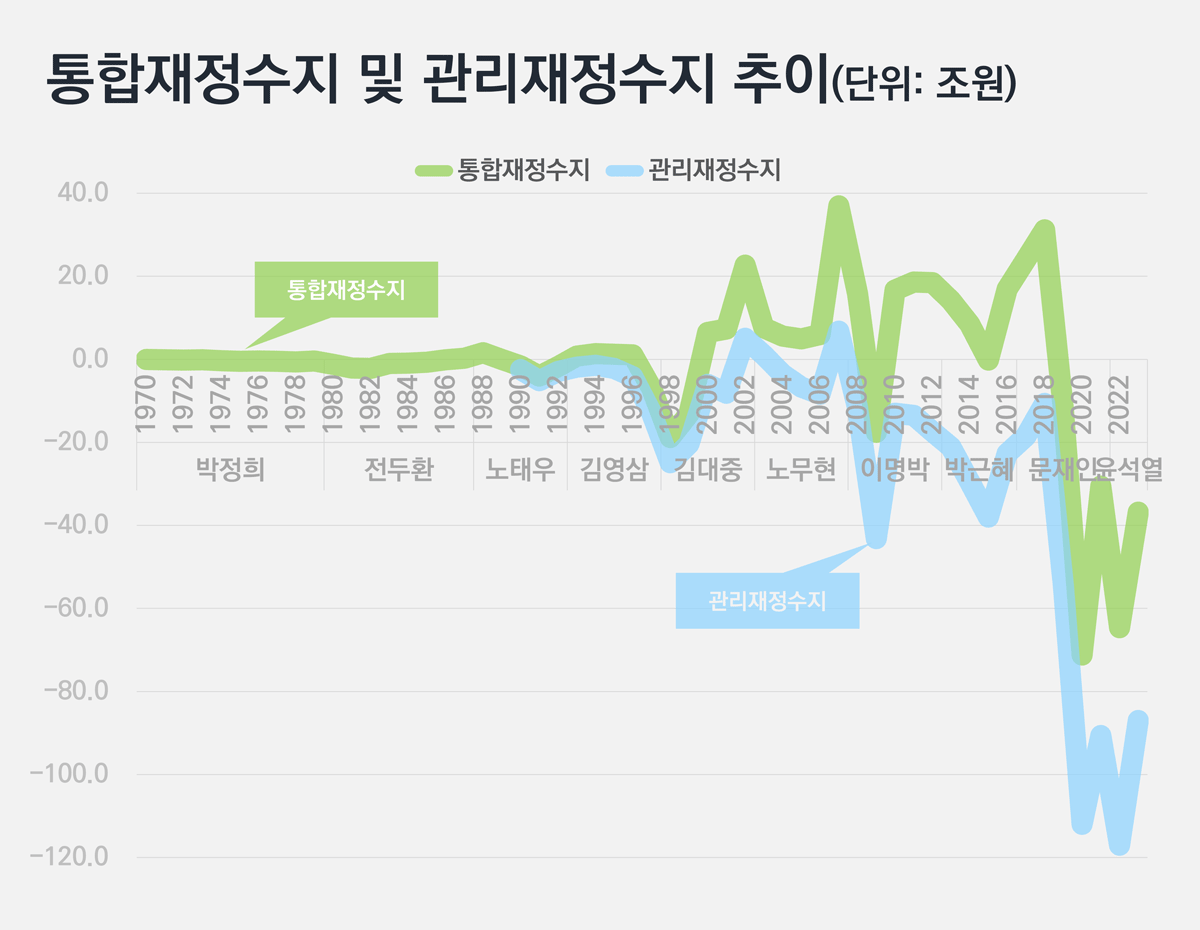
데이터: 기획재정부, KOSIS
주: 1) 대통령 임기 구분은 연도末 기준
2) 데이터 정리 과정에 Human error가 포함됐을 수 있음
3) 상세 데이터는 아래 표 4 참고
표 3. 성장률 비교: GDP vs. 국가채무(단위: %)
| 구분 | 명목 GDP 성장률 | 실질 GDP 성장률 | 국가채무 증감률 | |
| 김영삼 | 1997 | – | 6.2% | – |
| 김대중 | 1998 | -0.9% | -5.1% | 33.3% |
| 1999 | 10.1% | 11.5% | 22.6% | |
| 2000 | 10.2% | 9.1% | 12.8% | |
| 2001 | 8.5% | 4.9% | 9.5% | |
| 2002 | 11.0% | 7.7% | 9.9% | |
| 노무현 | 2003 | 6.7% | 3.1% | 23.9% |
| 2004 | 8.5% | 5.2% | 22.9% | |
| 2005 | 5.4% | 4.3% | 21.7% | |
| 2006 | 5.0% | 5.3% | 14.0% | |
| 2007 | 8.4% | 5.8% | 5.8% | |
| 이명박 | 2008 | 5.9% | 3.0% | 3.3% |
| 2009 | 4.4% | 0.8% | 16.4% | |
| 2010 | 9.7% | 6.8% | 9.1% | |
| 2011 | 5.0% | 3.7% | 7.2% | |
| 2012 | 3.7% | 2.4% | 5.4% | |
| 박근혜 | 2013 | 4.2% | 3.2% | 10.5% |
| 2014 | 4.1% | 3.2% | 8.9% | |
| 2015 | 6.1% | 2.8% | 10.9% | |
| 2016 | 5.0% | 2.9% | 6.0% | |
| 문재인 | 2017 | 5.5% | 3.2% | 5.3% |
| 2018 | 3.4% | 2.9% | 3.1% | |
| 2019 | 1.4% | 2.2% | 6.3% | |
| 2020 | 0.8% | -0.7% | 17.1% | |
| 2021 | 7.2% | 4.3% | 14.7% | |
| 윤석열 | 2022 | 3.9% | 2.6% | 10.0% |
| 2023 | 3.4% | 1.4% | 5.6% | |
데이터: 기획재정부, KOSIS
주: 1) 대통령 임기 구분은 연도末 기준
2) 성장률 및 증감률은 모두 전년 대비 기준
3) 데이터 정리 과정에 Human error가 포함됐을 수 있음
표 4. 통합재정수지 vs. 관리재정수지 추이(단위: 조원, %)
| 구분 | 통합재정수지 | GDP대비(%) | 관리재정수지 | GDP대비(%) | |
| 박정희 | 1970 | 0.0 | -1.0 | n/a | n/a |
| 1971 | -0.1 | -2.2 | n/a | n/a | |
| 1972 | -0.2 | -4.5 | n/a | n/a | |
| 1973 | -0.1 | -1.6 | n/a | n/a | |
| 1974 | -0.3 | -3.8 | n/a | n/a | |
| 1975 | -0.5 | -4.4 | n/a | n/a | |
| 1976 | -0.4 | -2.8 | n/a | n/a | |
| 1977 | -0.5 | -2.6 | n/a | n/a | |
| 1978 | -0.6 | -2.4 | n/a | n/a | |
| 1979 | -0.4 | -1.4 | n/a | n/a | |
| 전두환 | 1980 | -1.2 | -3.0 | n/a | n/a |
| 1981 | -2.1 | -4.3 | n/a | n/a | |
| 1982 | -2.2 | -3.9 | n/a | n/a | |
| 1983 | -1.0 | -1.4 | n/a | n/a | |
| 1984 | -0.9 | -1.2 | n/a | n/a | |
| 1985 | -0.7 | -0.8 | n/a | n/a | |
| 1986 | -0.1 | -0.1 | n/a | n/a | |
| 1987 | 0.3 | 0.2 | n/a | n/a | |
| 노태우 | 1988 | 1.6 | 1.1 | n/a | n/a |
| 1989 | 0.0 | 0.0 | n/a | n/a | |
| 1990 | -1.6 | -0.8 | -2.5 | -1.2 | |
| 1991 | -4.0 | -1.7 | -5.1 | -2.1 | |
| 1992 | -1.7 | -0.6 | -2.9 | -1.1 | |
| 김영삼 | 1993 | 0.8 | 0.3 | -1.9 | -0.6 |
| 1994 | 1.4 | 0.4 | -1.4 | -0.4 | |
| 1995 | 1.2 | 0.3 | -2.2 | -0.5 | |
| 1996 | 1.1 | 0.2 | -4.2 | -0.9 | |
| 1997 | -6.9 | -1.3 | -12.8 | -2.4 | |
| 김대중 | 1998 | -18.8 | -3.5 | -24.9 | -4.6 |
| 1999 | -13.1 | -2.2 | -20.4 | -3.5 | |
| 2000 | 6.5 | 1.0 | -6.0 | -0.9 | |
| 2001 | 7.3 | 1.0 | -8.2 | -1.2 | |
| 2002 | 22.7 | 2.9 | 5.1 | 0.6 | |
| 노무현 | 2003 | 7.6 | 0.9 | 1.0 | 0.1 |
| 2004 | 5.6 | 0.6 | -3.6 | -0.4 | |
| 2005 | 4.9 | 0.5 | -6.7 | -0.7 | |
| 2006 | 6.0 | 0.6 | -8.4 | -0.8 | |
| 2007 | 37.0 | 3.4 | 6.8 | 0.6 | |
| 이명박 | 2008 | 15.8 | 1.4 | -11.7 | -1.0 |
| 2009 | -17.6 | -1.5 | -43.2 | -3.6 | |
| 2010 | 16.7 | 1.3 | -13.0 | -1.0 | |
| 2011 | 18.6 | 1.3 | -13.5 | -1.0 | |
| 2012 | 18.5 | 1.3 | -17.4 | -1.2 | |
| 박근혜 | 2013 | 14.2 | 0.9 | -21.1 | -1.4 |
| 2014 | 8.5 | 0.5 | -29.5 | -1.9 | |
| 2015 | -0.2 | 0.0 | -38.0 | -2.3 | |
| 2016 | 16.9 | 1.0 | -22.7 | -1.3 | |
| 문재인 | 2017 | 24.0 | 1.3 | -18.5 | -1.0 |
| 2018 | 31.2 | 1.6 | -10.6 | -0.6 | |
| 2019 | -12.0 | -0.6 | -54.4 | -2.8 | |
| 2020 | -71.2 | -3.7 | -112.0 | -5.8 | |
| 2021 | -30.5 | -1.5 | -90.6 | -4.4 | |
| 윤석열 | 2022 | -64.6 | -3.0 | -117.0 | -5.4 |
| 2023 | -36.8 | -1.6 | -87.0 | -3.9 | |
데이터: 기획재정부, KOSIS
주: 1) 대통령 임기 구분은 연도末 기준
2) 데이터 정리 과정에 Human error가 포함됐을 수 있음
English Version>>
Last year, Government Debt reached an all-time high of KRW 1,126.7 trillion, and its share of GDP was 50.4%.
(Graphic·Data News) Based on the 2023 national settlement, the government debt reached an all-time high of 1,126.7 trillion won.
According to the ‘2023 Fiscal Year National Settlement Report’ deliberated and approved at the Cabinet meeting on the 11th, the day after the April 10 general elections, Korea’s government debt last year reached an all-time high of KRW 1,126.7 trillion, an increase of KRW 59.4 trillion from 2022 (see Graph 1 and Table 1).
This figure is 50.4% of the 2023 GDP (KRW 2,236.3 trillion in nominal terms), which is also the highest ever.
Graph 1. Trends in government debt by previous governments (unit: KRW 1 trillion, %)
Data: Ministry of Economy and Finance (MOEF), KOSIS
Note: 1) Presidential term classification is based on the end of the year.
2) Data for 2023 is provisional.
3) Human error may have been included in the data entry process.
Among the total government debt, ‘central government debt’ was 1,092.5 trillion won, an increase of 59.1 trillion won from the previous year, and it was ‘Korea treasury bonds (KTBs)’ that drove this (see Table 1).
This is because the balance of KTBs increased by 60.5 trillion won compared to 2022.
According to the government report, it is believed that this was mainly for the purpose of ‘preserving the general account deficit (KRW 54.3 trillion)’.
On the other hand, national housing bonds, foreign exchange equalization fund bonds, and borrowings decreased by approximately 500 billion won, 300 billion won, and 700 billion won, respectively, compared to 2022.
Table 1. Summary of government debt settlement for fiscal year 2023 (unit: trillion won, %, %p)
Data: MOEF
Note: 1) △ means negative number
2) Net debt of the local government is the value of the total debt excluding the debt to the central government
3) Human error may have been included in the data entry process.
The government debt growth rate (compared to the previous year) peaked in 2020 (COVID-19 response project) for three consecutive years, and the GDP growth rate (both nominal and real) peaked in 2021 and declined for two consecutive years (see Graph 2).
For reference, looking at the long-term trends of national debt growth rate and GDP growth rate, it appears that the increase in national debt is driving the GDP growth rate, but the results (direction and size) may vary depending on the use of the national debt.
Graph 2. Growth rate trend: GDP vs. Government debt (unit: %)
Data: MOEF, KOSIS
Note: 1) Presidential term classification is based on the end of the year.
2) Growth rate is the rate of change (YOY%) compared to the previous year for each item.
3) Human error may have been included in the data entry process.
4) Refer to Table 3 below for detailed data.
Meanwhile, last year’s integrated fiscal balance (total revenue minus total expenditure) was -36.8 trillion won, recording a deficit for five consecutive years since 2019 (see Tables 2, 4 and Graph 3).
Last year, total expenditures decreased by 71.7 trillion won compared to the previous year (reduction in COVID-19 response projects, reduction in local allocation taxes, etc.), but total income also decreased by 43.9 trillion won (mainly due to corporate tax, income tax, value-added tax, capital gains tax, etc.).
In particular, total revenue was 51.8 trillion won less than last year’s budget (plan).
Therefore, the consolidated fiscal balance deficit decreased by 27.8 trillion won compared to 2022, but increased by 23.7 trillion won compared to the 2023 budget (plan).
And this phenomenon was also reflected in the management financial balance.
In other words, the management financial balance decreased by 30.0 trillion won compared to 2022, but increased by 28.8 trillion won compared to the 2023 budget (plan).
Therefore, the standard of the Yoon Seok-yeol government, which attempted to differentiate itself from the previous government by emphasizing fiscal soundness (the share of managed fiscal balance to GDP, ‘within 3.0%’ suggested by the fiscal rules), was exceeded by 0.9 percentage points.
For reference, this is the first time that total income and total expenditure have decreased since the concept of total income and total expenditure was introduced in 2005.
Table 2. Summary of central government fiscal balance settlement for fiscal year 2023 (unit: trillion won, %, %p)
Data: MOEF
Note: 1) △ means negative number
2) Nominal GDP (based on announcement by the Bank of Korea on March 5, 2024) → (2022) 2,161.8 trillion won/(2023) 2,236.3 trillion won (provisional value)
3) Human error may have been included in the data entry process.
From a mid-to long-term perspective, looking at the trends in the integrated fiscal balance (since 1970) and the managed fiscal balance (since 1990), the movements in fiscal balance in recent years are interpreted as being very unstable.
Graph 3. Integrated fiscal balance vs. Management financial balance trend (unit: trillion won)
Data: MOEF, KOSIS
Note: 1) Presidential term classification is based on the end of the year.
2) Human error may have been included in the data entry process.
3) Refer to Table 4 below for detailed data.
Table 3. Comparison of growth rates: GDP vs. Government debt (unit: %)
Data: MOEF, KOSIS
Note: 1) Presidential term classification is based on the end of the year.
2) All growth rates and change rates are based on the previous year.
3) Human error may have been included in the data entry process.
Table 4. Consolidated fiscal balance vs. Management financial balance trend (unit: trillion won, %)
Data: MOEF, KOSIS
Note: 1) Presidential term classification is based on the end of the year.
2) Human error may have been included in the data entry process.