(그래픽·데이터 뉴스) 지난해 주택담보대출의 증가로, 2022년 소폭 하락했던 가계대출 잔액이 다시 증가한 것으로 나타났다.
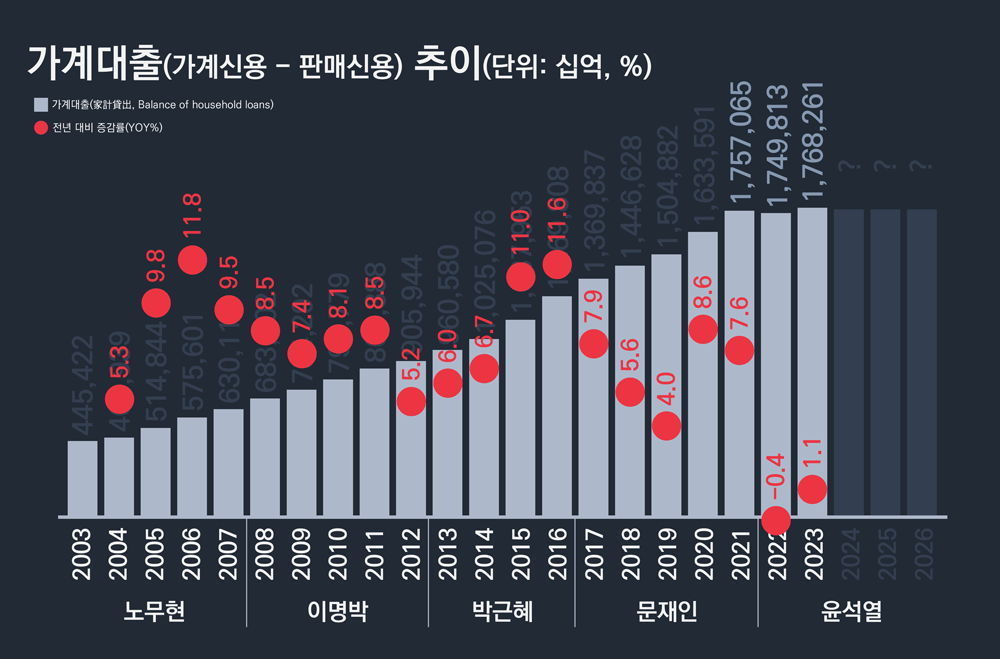
한국은행 경제통계시스템(ECOS, Economic Statistics System)에 따르면, 지난해(말) 가계대출 잔액이 일 년 전인 2022년말보다 1.1% 증가한 1768조2614억인 것으로 나타났다.
그래프 1. 2003-2023 가계대출 잔액 추이(단위: 십억, %)
데이터: 한은 경제통계시스템(ECOS)
주: 1) 대통령 임기는 해당 연도末 기준
2) 데이터 정리 과정에 Human error가 포함됐을 수 있음
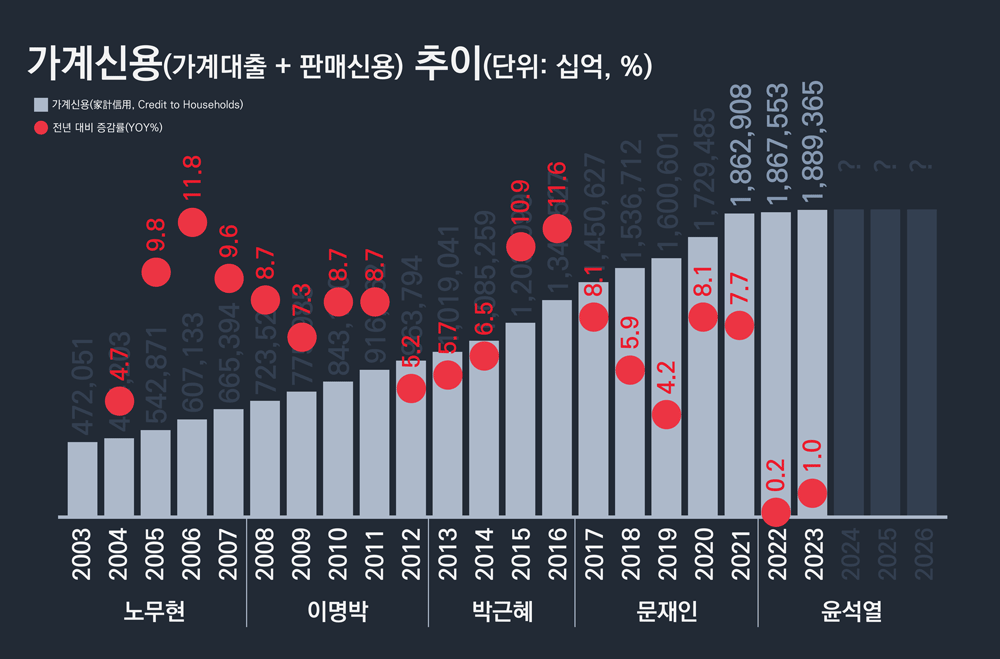
‘가계대출’은 ‘판매신용’과 함께 ‘가계신용(Credit to Households)’을 구성한다.
즉, ‘가계신용 = 가계대출 + 판매신용’이다.
그리고 ‘가계대출’은 ‘가계신용’에서 통상 약 94% 정도를 차지한다.
그래서 당연히 지난해 가계신용 잔액도 가계대출과 유사한 수준(1.0%)으로 증가했다.
그래프 2. 가계신용(가계대출 + 판매신용) 잔액 추이(단위: 십억, %)
데이터: 한은 경제통계시스템(ECOS)
주: 1) 판매신용: 신용카드사, 할부금융사 등 여신전문기관은 물론 백화점이나 자동차, 가전 등의 판매 회사가 소비자에게 제공하는 신용
2) 데이터 정리 과정에 Human error가 포함됐을 수 있음
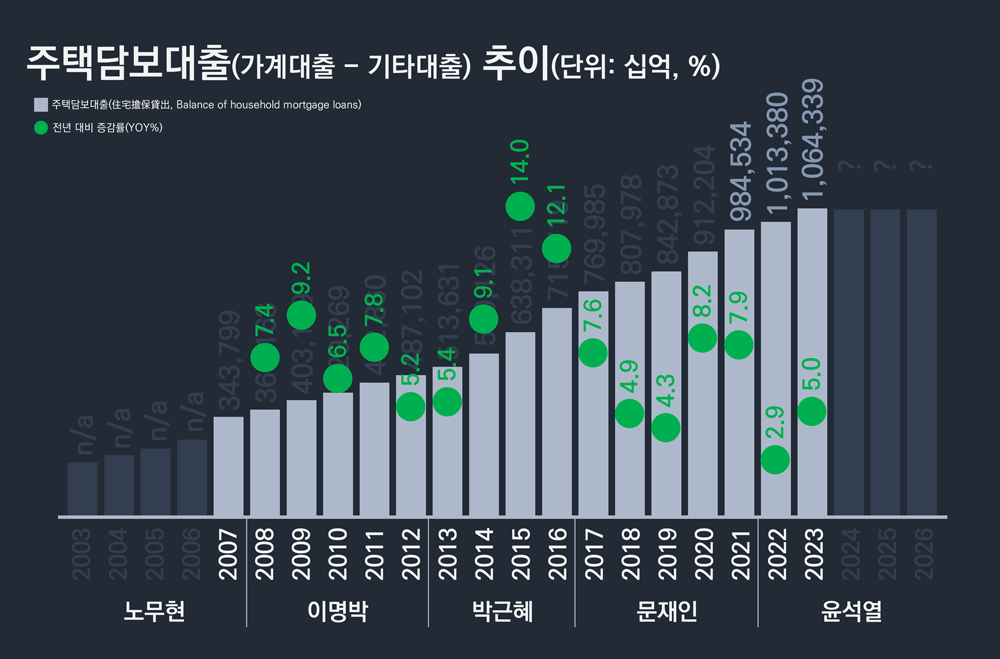
지난해 가계대출이 이렇게 증가한 이유는 바로 ‘주택담보대출(이하 ‘주담대’로도 표기)’이 증가했기 때문이다.
2022년 부동산 시장의 환경 변화로 주춤하던, 주택담보대출 잔액, 증가세가 지난해 5%(약 51조)나 증가했다.
표 1. 최근 7년간 주택담보대출 잔액 추이(단위: 십억, %)
| 구분 | 2017 | 2018 | 2019 | 2020 | 2021 | 2022 | 2023 |
| 주담대 잔액 | 769,985 | 807,978 | 842,873 | 912,204 | 984,534 | 1,013,380 | 1,064,339 |
| 증감률 | 7.6 | 4.9 | 4.3 | 8.2 | 7.9 | 2.9 | 5.0 |
| 증감액 | 54,265 | 37,993 | 34,895 | 69,331 | 72,331 | 28,845 | 50,960 |
데이터: 한은 경제통계시스템(ECOS)
주: 데이터 정리 과정에 Human error가 포함됐을 수 있음
그래프 3. 주택담보대출 잔액 추이(단위: 십억, %)
데이터: 한은 경제통계시스템(ECOS)
주: 1) 대통령 임기는 해당 연도末 기준
2) 데이터 정리 과정에 Human error가 포함됐을 수 있음
구체적으로 지난해 주택담보대출의 증가를 견인한 것은 주로 ‘기타금융기관’이다.
기타금융기관은 보험사, 연금기금, 여신전문기관, 공적금융기관, 기타금융중개회사 등으로 구성되며, 이중 공적금융기관의 주담대 잔액이 두 자릿수 이상 증가했다.
반면, 비은행예금취급기관(상호저축은행, 신용협동조합, 상호금융, 새마을금고, 우체국 등)의 주택담보대출 잔액은 전년 대비 5조985억 감소했다.
표 2. 주택담보대출 구분(단위: 십억, %)
| 구분 | 2022(A) | 2023(B) | |||
| 증감률(B/A%) | 증감액(B-A) | 점유율 | |||
| 주담대(Total) | 1,013,380 | 1,064,339 | 5.0% | 50,960 | 100.0% |
| 예금취급기관 | 754,831 | 777,710 | 3.0% | 22,879 | 44.9% |
| 예금은행 | 644,132 | 672,110 | 4.3% | 27,978 | 54.9% |
| 비은행예금취급기관 | 110,699 | 105,600 | -4.6% | -5,099 | -10.0% |
| 기타금융기관 | 258,548 | 286,629 | 10.9% | 28,080 | 55.1% |
| 주공 등3) | 201,119 | 229,964 | 14.3% | 28,845 | 56.6% |
데이터: 한은 경제통계시스템(ECOS)
주: 1) 비은행예금취급기관: 상호저축은행, 신용협동조합, 상호금융, 새마을금고, 우체국 등
2) 기타금융기관 등: 보험사, 연금기금, 여신전문기관, 공적금융기관, 기타금융중개회사 등
3) 주택금융공사 및 주택도시기금의 주택담보대출
4) 데이터 정리 과정에 Human error가 포함됐을 수 있음
이에 반해, 가계대출 중 ‘기타대출’의 잔액은 최근 2년간 오히려 감소했다.
구체적으로, ECOS 통계에 따르면, 기타대출 잔액은 2022년과 2023년 각각 전년 대비 36조0970억, 32조5116억씩 감소했다.
표 3. 최근 7년간 기타대출 잔액 추이(단위: 십억, %)
| 구분 | 2017 | 2018 | 2019 | 2020 | 2021 | 2022 | 2023 |
| 기타대출 잔액 | 599,852 | 638,651 | 662,009 | 721,387 | 772,531 | 736,434 | 703,922 |
| 증감률 | 8.3 | 6.5 | 3.7 | 9.0 | 7.1 | -4.7 | -4.4 |
| 증감액 | 45,764 | 38,798 | 23,358 | 59,378 | 51,144 | -36,097 | -32,512 |
데이터: 한은 경제통계시스템(ECOS)
주: 데이터 정리 과정에 Human error가 포함됐을 수 있음
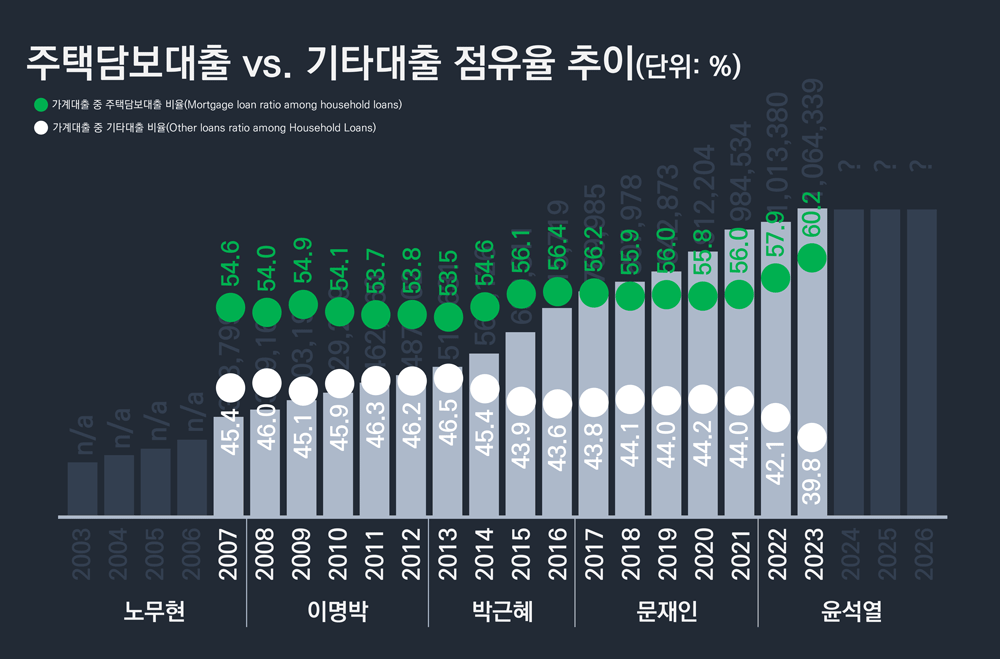
그래서 가계대출 중 ‘주택담보대출’과 ‘기타대출’의 점유율 차(差, Gap)가 최근 더 빠르게 벌어지고 있다.
그래프 4. 주택담보대출 대 기타대출 점유율 추이(단위: %)
데이터: 한은 경제통계시스템(ECOS)
주: 1) 대통령 임기는 해당 연도末 기준
2) 데이터 정리 과정에 Human error가 포함됐을 수 있음
English Version>>
Graphics and Data News: Due to an Increase in Household Mortgage Loans last year, Total Household Loans, Which Fell Slightly in 2022, Will Increase Again
(Graphic·Data News) Due to the increase in household mortgage loans last year, the total household loan balance, which had fallen slightly in 2022, increased again.
According to the Bank of Korea’s Economic Statistics System (ECOS), the household loan balance at the end of last year was KRW 1,768.2614 trillion, a 1.1% increase from the end of 2022, a year ago.
Graph 1. Household loan balance trend from 2003 to 2023 (unit: billion won, %)
Data: Bank of Korea Economic Statistics System (ECOS)
Note: 1) The presidential term is at the end of the year.
2) Human error may have been included in the data entry process.
Household loans constitute ‘Credit to Households’ along with ‘Sales Credit’.
In other words, it is ‘household credit = household loan + sales credit’.
And ‘household loans’ usually account for about 94% of ‘household credit’.
So, of course, the balance of Credit to Households’ increased to a level similar to that of household loans (1.0%) last year.
Graph 2. Changes in the Credit to Households (household loan + sales credit) (unit: billion won, %)
Data: Bank of Korea Economic Statistics System (ECOS)
Note: 1) Sales credit: Credit provided to consumers by credit-specialized institutions such as credit card companies and installment finance companies, as well as department stores and companies selling automobiles and home appliances.
2) Human error may have been included in the data entry process.
The reason why household loans increased so much last year was because of the increase in ‘Household Mortgage Loans (HML)’.
The balance of Household Mortgage Loans, which had been slowing down due to environmental changes in the real estate market in 2022, increased by 5% (approximately KRW 51 trillion) last year.
Table 1. Trends in Household Mortgage Loans balance over the past 7 years (unit: billion won, %)
| Cls. | 2017 | 2018 | 2019 | 2020 | 2021 | 2022 | 2023 |
| HML balance | 769,985 | 807,978 | 842,873 | 912,204 | 984,534 | 1,013,380 | 1,064,339 |
| YOY% | 7.6 | 4.9 | 4.3 | 8.2 | 7.9 | 2.9 | 5.0 |
| Growth Amt. | 54,265 | 37,993 | 34,895 | 69,331 | 72,331 | 28,845 | 50,960 |
Data: Bank of Korea Economic Statistics System (ECOS)
Note: Human error may have been included in the data entry process.
Graph 3. Home mortgage loan balance trend (unit: billion won, %)
Data: Bank of Korea Economic Statistics System (ECOS)
Note: 1) The presidential term is at the end of the year.
2) Human error may have been included in the data entry process.
Specifically, it was mainly ‘other financial institutions’ that drove the increase in home mortgage loans last year.
Other financial institutions consist of insurance companies, pension funds, credit institutions, public financial institutions, and other financial intermediary companies, among which the balance of main loans at public financial institutions has increased by more than double digits.
On the other hand, the balance of home mortgage loans from non-bank depository institutions (mutual savings banks, credit unions, mutual finance, Saemaeul Geumgo, post offices, etc.) decreased by KRW 5.0985 trillion compared to the previous year.
Table 2. Category of housing mortgage loans (unit: billion won, %)
| Cls | 2022(A) | 2023(B) | |||
| YOY%(B/A%) | Growth(B-A) | Share | |||
| HML balance(Total) | 1,013,380 | 1,064,339 | 5.0% | 50,960 | 100.0% |
| Depository Corp. | 754,831 | 777,710 | 3.0% | 22,879 | 44.9% |
| Bank | 644,132 | 672,110 | 4.3% | 27,978 | 54.9% |
| Non-bank Corp. | 110,699 | 105,600 | -4.6% | -5,099 | -10.0% |
| Other Financial Corp. | 258,548 | 286,629 | 10.9% | 28,080 | 55.1% |
| KHFC etc.3) | 201,119 | 229,964 | 14.3% | 28,845 | 56.6% |
Data: Bank of Korea Economic Statistics System (ECOS)
Note: 1) Non-bank depository corporations: mutual savings banks, credit unions, mutual credits, community credit cooperatives, postal savings, etc.
2) Other financial corporations, etc: insurance companies, pension funds, specialized credit financial companies, public financial institutions, other financial intermediaries, etc.
3) Household mortgage loans by Korea Housing Finance Corporation (KHFC) & housing and urban fund
4) Human error may have been included in the data entry process.
In contrast, the balance of ‘Other Loans (OL)’ among household loans has actually decreased over the past two years.
Specifically, according to ECOS statistics, other loan balances decreased by 36.097 trillion won and 32.5116 trillion won in 2022 and 2023, respectively, compared to the previous year.
Table 3. Other Loan (OL) balance trends over the past 7 years (unit: billion won, %)
| Cls. | 2017 | 2018 | 2019 | 2020 | 2021 | 2022 | 2023 |
| OL balance | 599,852 | 638,651 | 662,009 | 721,387 | 772,531 | 736,434 | 703,922 |
| YOY% | 8.3 | 6.5 | 3.7 | 9.0 | 7.1 | -4.7 | -4.4 |
| Growth Amt. | 45,764 | 38,798 | 23,358 | 59,378 | 51,144 | -36,097 | -32,512 |
Data: Bank of Korea Economic Statistics System (ECOS)
Note: Human error may have been included in the data entry process.
Therefore, the gap in the share of household loans between ‘home mortgage loans’ and ‘other loans’ has been widening faster recently.
Graph 4. Home mortgage loan vs. other loan share trend (unit: %)
Data: Bank of Korea Economic Statistics System (ECOS)
Note: 1) The presidential term is at the end of the year.
2) Human error may have been included in the data entry process.


