(그래픽·데이터 뉴스) 올해 11월 말 기준 ‘카드론 잔액’과 ‘리볼빙 잔액’ 모두 전년 동기 대비 상승세를 이어가고 있다.
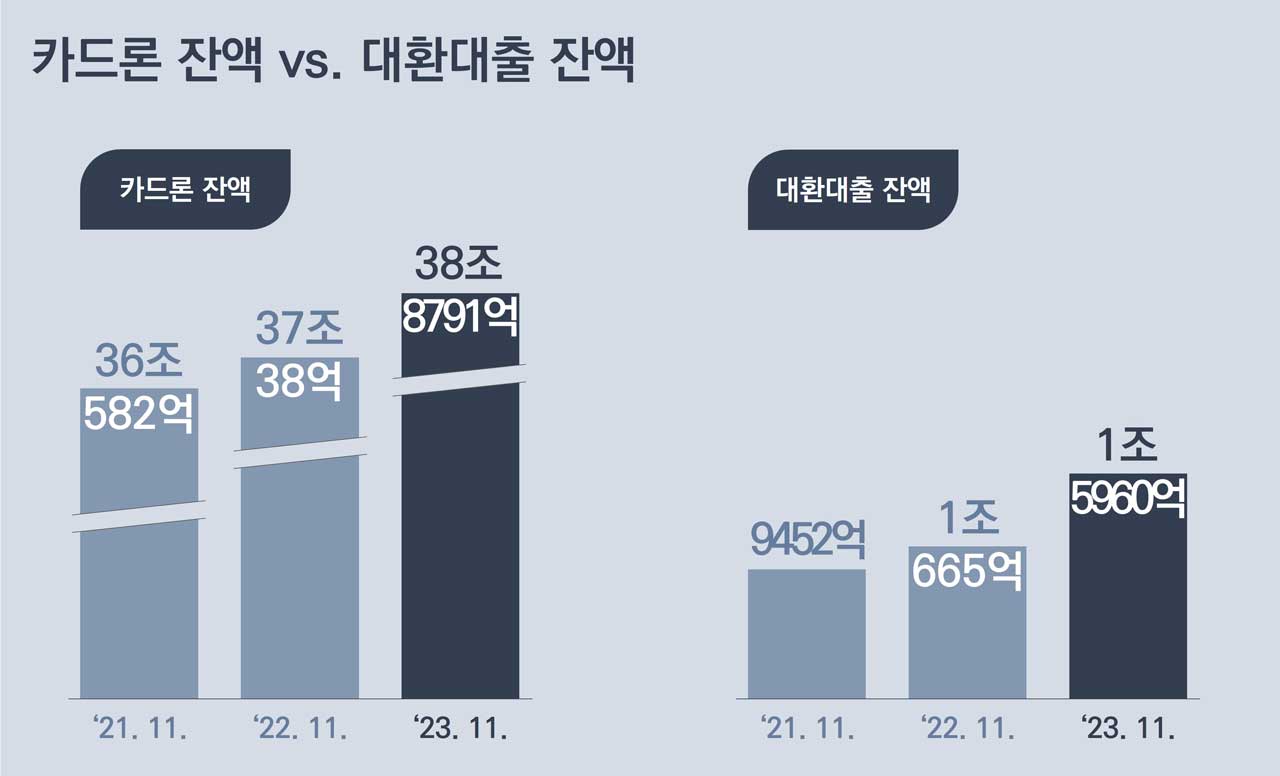
그래프 1. 카드론 잔액 vs. 대환대출 잔액
자료: 여신금융협회(Credit Finance Association)
여신금융협회가 어제 인터넷에 게재한 ‘신용카드 이용실적’ 데이터에 따르면, 올해 11월 말 ‘카드론 잔액’은 38조8791억원으로 지난해 11월 말보다 1조8753억원(증가율로는 5.1%)이나 증가한 것으로 분석됐다.
그리고 카드론 중 ‘대환대출 잔액’도 1조5960억원으로 전년 동기보다 5296억원(증가율로는 49.7%)이나 증가했다. 대환대출 잔액의 규모는 크지 않지만 증가율은 상당히 위협적이다.
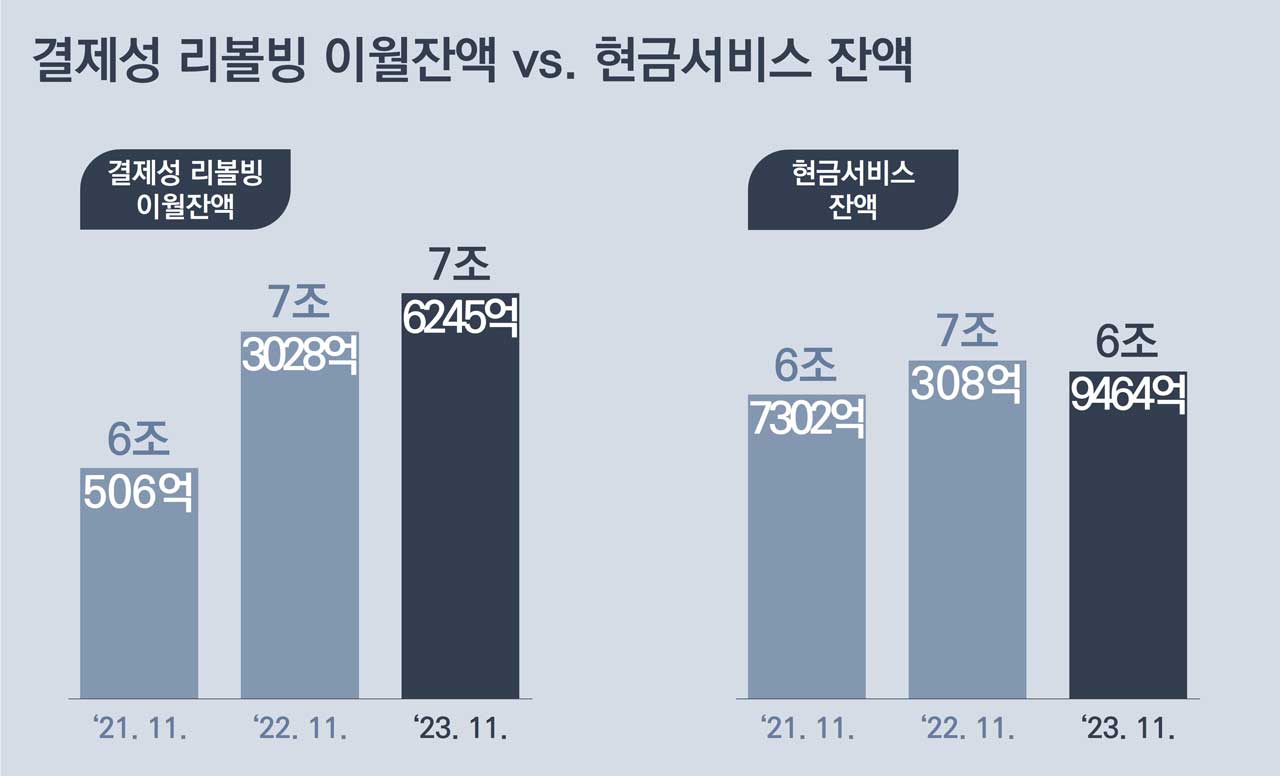
그래프 2. 결제성 리볼빙 이월잔액 vs. 현금서비스 잔액
자료: 여신금융협회(Credit Finance Association)
이와 더불어 결제성 리볼빙(Revolving, 일부 결제금액 이월약정) 잔액은 올해 11월 말 기준 7조6245억원으로 지난해 11월 말보다 3216억원(증가율로는 4.4%) 증가했다.
이는 지난해 증가율인 20.7%보다 확실히 둔화된 수치다. 그러나 아직까지 이의 증가세가 멈춘 것은 아니다. 실제 올해 3월에 큰 폭으로 하락했던 결제성 리볼빙 이월잔액이 4월부터 다시 꾸준히 증가세를 이어가고 있다(아래 ‘표 1’ 참고).
표 1. 월별 리볼빙 이월잔액 추이(단위: 백만원)
| 월 | 리볼빙 이월잔액 | 전월 대비 증감 | |
| 2022년 11월 | 7,302,827 | – | – |
| 12월 | 7,357,401 | 54,574 | 0.7% |
| 2023년 1월 | 7,366,591 | 9,190 | 0.1% |
| 2월 | 7,390,106 | 23,515 | 0.3% |
| 3월 | 7,215,001 | -175,105 | -2.4% |
| 4월 | 7,277,540 | 62,539 | 0.9% |
| 5월 | 7,340,012 | 62,472 | 0.9% |
| 6월 | 7,373,465 | 33,453 | 0.5% |
| 7월 | 7,414,888 | 41,423 | 0.6% |
| 8월 | 7,486,417 | 71,529 | 1.0% |
| 9월 | 7,612,583 | 126,166 | 1.7% |
| 10월 | 7,583,231 | -29,352 | -0.4% |
| 11월 | 7,624,471 | 41,240 | 0.5% |
자료: 여신금융협회(Credit Finance Association)
주: 데이터 정리 과정에서 Human error가 포함됐을 수 있음
카드사별로 결제성 리볼빙 잔액을 살펴보면(전년 동기 대비), ① 절대액 기준으로는 KB국민카드가 업계에서 가장 크게 상승(1584억)했고, ② 증가율 기준으로는 BC카드(자체)가 387.9%로 가장 크게 상승했다(아래 ‘표 3’ 참고).
한편, 현대카드는 업계에서 유일하게 결제성 리볼빙 잔액이 일 년 전보다 감소했다. 구체적으로 현대카드의 올해 11월 말 결제성 리볼빙 잔액은 9925억이다. 이는 지난해 11월 말 잔액 1조2919억에서 2994억 정도 감소한 수치다.
왜곡 없이 보다 정확한 데이터를 전달하기 위해 아래에 상세한 데이터를 추가했다.
표 2. 신용카드 관련 금융 부채 누계액(단위: 백만원)
| 구분 | 2021. 11. (A) |
2022. 11. (B) |
B-A (증감률) |
2023. 11. (C) |
C-B (증감률) |
| (결제성)리볼빙 이월잔액 | 6,050,596 | 7,302,827 | 1,252,231 (+20.7%) |
7,624,471 | 321,644 (4.4%) |
| 현금서비스 잔액 | 6,730,232 | 7,030,752 | 300,520 (+4.5%) |
6,946,369 | -84,383 (-1.2%) |
| 카드론 잔액 | 36,058,228 | 37,003,764 | 945,536 (+2.6%) |
38,879,106 | 1,875,342 (+5.1%) |
| 대환대출 잔액 | 945,184 | 1,066,460 | 121,276 (+12.8%) |
1,596,010 | 529,550 (+49.7%) |
자료: 여신금융협회(Credit Finance Association)
주: 1) 회사별 데이터는 그래프 아래 참고
2) 데이터 정리 과정에서 Human error가 포함됐을 수 있음
표 3. 결제성 리볼빙 이월잔액(단위: 백만원)
| 회사 | 2021. 11. (A) |
2022. 11. (B) |
B-A (증감률) |
2023. 11. (C) |
C-B (증감률) |
| 롯데 | 720,707 | 965,767 | 245,060 (34.0%) |
1,098,163 | 132,396 (13.7%) |
| 비씨 | 0 | 2,779 | 2,779 (-) |
13,560 | 10,781 (387.9%) |
| 삼성 | 1,031,180 | 1,220,056 | 188,876 (18.3%) |
1,339,526 | 119,470 (9.8%) |
| 신한 | 1,256,210 | 1,476,225 | 220,015 (17.5%) |
1,612,888 | 136,663 (9.3%) |
| 우리 | 356,668 | 442,339 | 85,671 (24.0%) |
456,236 | 13,897 (3.1%) |
| 하나 | 404,136 | 434,958 | 30,822 (7.6%) |
461,038 | 26,080 (6.0%) |
| 현대 | 1,027,295 | 1,291,912 | 264,617 (25.8%) |
992,540 | -299,372 (-23.2%) |
| KB국민 | 1,193,515 | 1,379,241 | 185,726 (15.6%) |
1,537,597 | 158,356 (11.5%) |
| NH농협 | 60,885 | 89,550 | 28,665 (47.1%) |
112,923 | 23,373 (26.1%) |
| 합계 | 6,050,596 | 7,302,827 | 1,252,231 (20.7%) |
7,624,471 | 321,644 (4.4%) |
자료: 여신금융협회(Credit Finance Association)
주: 데이터 정리 과정에서 Human error가 포함됐을 수 있음
표 4. 현금서비스 잔액(단위: 백만원)
| 회사 | 2021. 11. (A) |
2022. 11. (B) |
B-A (증감률) |
2023. 11. (C) |
C-B (증감률) |
| 롯데 | 706,534 | 774,312 | 67,778 (9.6%) |
783,206 | 8,894 (1.1%) |
| 비씨 | 357 | 1,262 | 905 (253.5%) |
5,043 | 3,781 (299.6%) |
| 삼성 | 1,043,463 | 1,189,213 | 145,750 (14.0%) |
981,563 | -207,650 (-17.5%) |
| 신한 | 1,691,004 | 1,756,178 | 65,174 (3.9%) |
1,633,262 | -122,916 (-7.0%) |
| 우리 | 666,544 | 713,496 | 46,952 (7.0%) |
688,672 | -24,824 (-3.5%) |
| 하나 | 397,563 | 414,544 | 16,981 (4.3%) |
406,439 | -8,105 (-2.0%) |
| 현대 | 672,691 | 520,623 | -152,068 (-22.6%) |
604,606 | 83,983 (16.1%) |
| KB국민 | 1,153,500 | 1,236,936 | 83,436 (7.2%) |
1,343,365 | 106,429 (8.6%) |
| NH농협 | 398,576 | 424,188 | 25,612 (6.4%) |
500,213 | 76,025 (17.9%) |
| 합계 | 6,730,232 | 7,030,752 | 300,520 (4.5%) |
6,946,369 | -84,383 (-1.2%) |
자료: 여신금융협회(Credit Finance Association)
주: 데이터 정리 과정에서 Human error가 포함됐을 수 있음
표 5. 카드론 잔액(단위: 백만원)
| 회사 | 2021. 11. (A) |
2022. 11. (B) |
B-A (증감률) |
2023. 11. (C) |
C-B (증감률) |
| 롯데 | 3,740,437 | 3,940,328 | 199,891 (5.3%) |
4,374,004 | 433,676 (11.0%) |
| 비씨 | 104 | 3,173 | 3,069 (2951.0%) |
29,382 | 26,209 (826.0%) |
| 삼성 | 5,819,506 | 5,804,283 | -15,223 (-0.3%) |
5,763,113 | -41,170 (-0.7%) |
| 신한 | 7,727,914 | 7,953,024 | 225,110 (2.9%) |
8,174,494 | 221,470 (2.8%) |
| 우리 | 3,132,275 | 2,818,735 | -313,540 (-10.0%) |
3,299,308 | 480,573 (17.0%) |
| 하나 | 2,528,753 | 2,688,720 | 159,967 (6.3%) |
2,899,716 | 210,996 (7.8%) |
| 현대 | 4,680,370 | 4,766,948 | 86,578 (1.8%) |
4,738,888 | -28,060 (-0.6%) |
| KB국민 | 5,902,199 | 6,314,573 | 412,374 (7.0%) |
6,682,010 | 367,437 (5.8%) |
| NH농협 | 2,526,670 | 2,713,980 | 187,310 (7.4%) |
2,918,191 | 204,211 (7.5%) |
| 합계 | 36,058,228 | 37,003,764 | 945,536 (2.6%) |
38,879,106 | 1,875,342 (5.1%) |
자료: 여신금융협회(Credit Finance Association)
주: 데이터 정리 과정에서 Human error가 포함됐을 수 있음
표 6. 카드론 중 대환대출 잔액(단위: 백만원)
| 회사 | 2021. 11. (A) |
2022. 11. (B) |
B-A (증감률) |
2023. 11. (C) |
C-B (증감률) |
| 롯데 | 22,602 | 30,967 | 8,365 (37.0%) |
81,076 | 50,109 (161.8%) |
| 비씨 | 0 | 0 | 0 (-) |
0 | 0 (-) |
| 삼성 | 107,274 | 96,455 | -10,819 (-10.1%) |
117,409 | 20,954 (21.7%) |
| 신한 | 296,356 | 321,388 | 25,032 (8.4%) |
352,458 | 31,070 (9.7%) |
| 우리 | 85,546 | 126,838 | 41,292 (48.3%) |
226,584 | 99,746 (78.6%) |
| 하나 | 59,889 | 67,635 | 7,746 (12.9%) |
123,482 | 55,847 (82.6%) |
| 현대 | 129,651 | 154,249 | 24,598 (19.0%) |
249,176 | 94,927 (61.5%) |
| KB국민 | 224,251 | 250,438 | 26,187 (11.7%) |
412,406 | 161,968 (64.7%) |
| NH농협 | 19,615 | 18,490 | -1,125 (-5.7%) |
33,419 | 14,929 (80.7%) |
| 합계 | 945,184 | 1,066,460 | 121,276 (12.8%) |
1,596,010 | 529,550 (49.7%) |
자료: 여신금융협회(Credit Finance Association)
주: 데이터 정리 과정에서 Human error가 포함됐을 수 있음
English version>>
Graphic and Data News: As of November 2023, the Card Loan Balances Increased by KRW 1.8753 trillion year-on-year, and Revolving Balances Also Increased by KRW 321.6 billion.
(Graphic and Data News) As of the end of November this year, both ‘card loan balance’ and ‘revolving balance’ are continuing to rise compared to the same period last year.
Graph 1. Card Loan balance vs. Refinancing Loan balance
According to the “Credit Card Usage Performance” data posted on the Internet yesterday by the Korea Credit Finance Association, the “card loan balance” at the end of November this year was 38.8791 trillion won, an increase of 1.8753 trillion won (5.1% in growth rate) from the end of November last year.
In addition, the “Refining Loan balance” among credit card loans was 1.596 trillion won, an increase of 529.6 billion won (49.7% in growth rate) from the same period last year. Although the balance of the loan is not large, the growth rate is quite threatening.
Graph 2. Revolving Carryover balance vs. Cash Service balance
In addition, the balance of Revolving (partial payment carryover agreements) reached 7.6245 trillion won as of the end of November this year, an increase of 321.6 billion won (4.4% in growth rate) from the end of November last year.
This is a significant slowdown from last year’s 20.7 percent in growth rate. However, the increase has not stopped yet. In fact, the revolving balance, which fell sharply in March this year, has been steadily increasing again since April (see “Table 1” below).
Table 1. Monthly Revolving Carryover balance trend (Unit: KRW 1 million)
Looking at the “increase (compared to the same period last year)” of the balance of revolving balance by credit card companies, ① KB Kookmin Card rose the largest in the industry (158.4 billion) in terms of absolute amount, and ② BC Card rose the largest at 387.9% in terms of growth rate (see “Table 3” below).
Meanwhile, Hyundai Card is the only one in the industry whose balance of revolving has decreased from a year ago. Specifically, Hyundai Card’s balance of revolving at the end of November this year was 992.5 billion won. The figure represents a decrease of 299.4 billion won from 1.2919 trillion won at the end of November last year.
Detailed data were added below to deliver more accurate data without distortion.
Table 2. Accumulated credit card-related financial liabilities (Unit: KRW 1 million)
Table 3. Revolving Carryover balance (Unit: KRW 1 million)
Table 4. Cash Service balance (Unit: KRW 1 million)
Table 5. Card Loan balance by credit card company (Unit: KRW 1 million)
Table 6. Refinancing Loan balance among card loans (Unit: KRW 1 million)


