이 글은 기사가 아닙니다. ‘기자 수첩’은 기자의 생각이나 정보를 간단하게 공유하기 위해 작성한 글입니다.
(기자 수첩) 정부와 국회가 출산율을 반등시킬 효과적인 대안을 제시하지 못하는 이 순간에도 출산율은 추락하고 있다.
천문학적인 혈세를 낭비하고도 왜 출산율을 반등시키지 못하는 것일까?
나라가 소멸 단계에 들어섰음에도 모두가 눈앞의 이익만을 쫓고 있다.
전국 각지에서 제각기 의미 없는 성냥불만 쉬지 않고 피워 댄다.
의미 없이 예산만 낭비되고 있는 것이다.
이런 방식이 통하지 않아 가계, 기업, 국가 경제가, 그리고 교육과 국방을 비롯한 국가의 주요 시스템들이 무너지고 있음에도, 정부와 국회는 아직도 정쟁(政爭, Political Strife)과 부동산(不動産, Property Speculation)에 목을 매고 있다.
이러다 정말 우리나라 대한민국이 지구에서 완전히 사라질 것 같다.
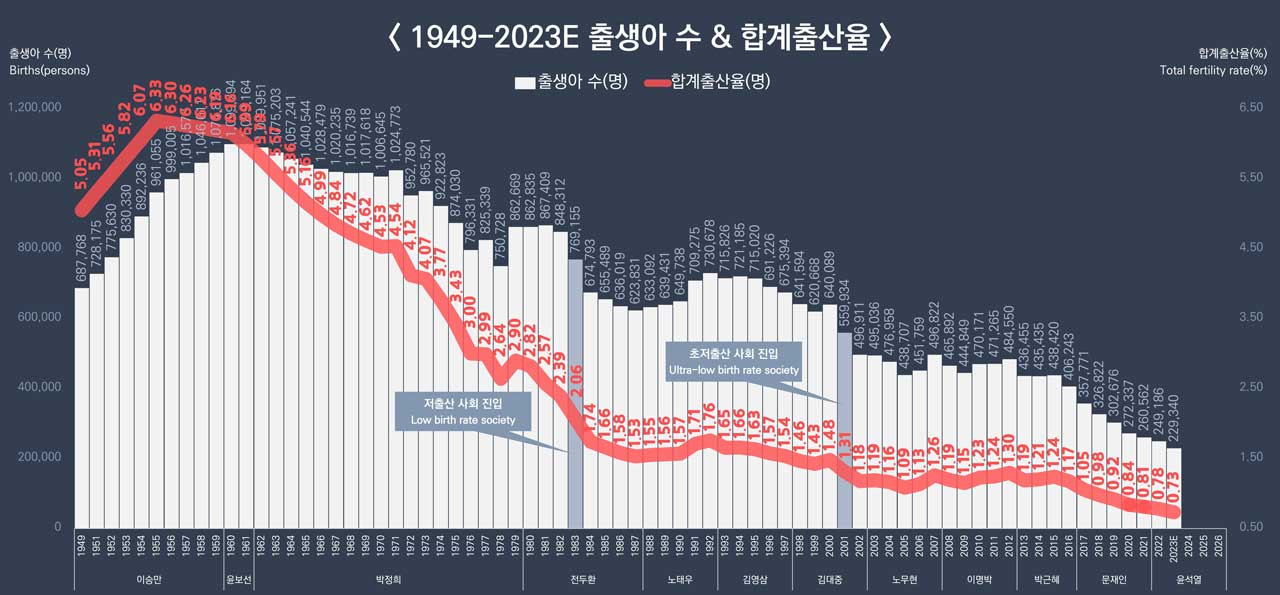
그래프 1. 연도별 출생아 수 및 합계출산율 추이(단위: 명, %) – 가로형
자료: 통계청, 행정안전부 주민등록 인구통계
주: 1) 대통령 임기는 해당 연도末 기준
2) 2023E는 本紙 추정치(아래 표 1에 ‘행정안전부 주민등록 인구통계’上 출생아 수 추가)
3) 모바일 이용자들을 위한 세로형 그래프는 맨 아래 삽입
표 1. 연도별 출생아 수 및 합계출산율 추이(단위: 명, %)
| 구분 | 연도 | 출생아 수 | 전년 대비 | 합계출산율 | 비고 | |
| 증감 수 | 증감률 | |||||
| 이승만 | 1949 | 687,768 | – | – | 5.05 | |
| 1951 | 728,175 | 40,407 | 5.9 | 5.31 | ||
| 1952 | 775,630 | 47,455 | 6.5 | 5.56 | ||
| 1953 | 830,330 | 54,700 | 7.1 | 5.82 | ||
| 1954 | 892,236 | 61,906 | 7.5 | 6.07 | ||
| 1955 | 961,055 | 68,819 | 7.7 | 6.33 | ||
| 1956 | 999,005 | 37,950 | 3.9 | 6.30 | ||
| 1957 | 1,016,573 | 17,568 | 1.8 | 6.26 | ||
| 1958 | 1,046,011 | 29,438 | 2.9 | 6.23 | ||
| 1959 | 1,074,876 | 28,865 | 2.8 | 6.19 | ||
| 윤보선 | 1960 | 1,099,294 | 24,418 | 2.3 | 6.16 | |
| 1961 | 1,099,164 | -130 | -0.0 | 5.99 | ||
| 박정희 | 1962 | 1,089,951 | -9,213 | -0.8 | 5.79 | |
| 1963 | 1,075,203 | -14,748 | -1.4 | 5.57 | ||
| 1964 | 1,057,241 | -17,962 | -1.7 | 5.36 | ||
| 1965 | 1,040,544 | -16,697 | -1.6 | 5.16 | ||
| 1966 | 1,028,479 | -12,065 | -1.2 | 4.99 | ||
| 1967 | 1,020,235 | -8,244 | -0.8 | 4.84 | ||
| 1968 | 1,016,739 | -3,496 | -0.3 | 4.72 | ||
| 1969 | 1,017,618 | 879 | 0.1 | 4.62 | ||
| 1970 | 1,006,645 | -10,973 | -1.1 | 4.53 | ||
| 1971 | 1,024,773 | 18,128 | 1.8 | 4.54 | ||
| 1972 | 952,780 | -71,993 | -7.0 | 4.12 | ||
| 1973 | 965,521 | 12,741 | 1.3 | 4.07 | ||
| 1974 | 922,823 | -42,698 | -4.4 | 3.77 | ||
| 1975 | 874,030 | -48,793 | -5.3 | 3.43 | ||
| 1976 | 796,331 | -77,699 | -8.9 | 3.00 | ||
| 1977 | 825,339 | 29,008 | 3.6 | 2.99 | ||
| 1978 | 750,728 | -74,611 | -9.0 | 2.64 | ||
| 1979 | 862,669 | 111,941 | 14.9 | 2.90 | ||
| 전두환 | 1980 | 862,835 | 166 | 0.0 | 2.82 | |
| 1981 | 867,409 | 4,574 | 0.5 | 2.57 | ||
| 1982 | 848,312 | -19,097 | -2.2 | 2.39 | ||
| 1983 | 769,155 | -79,157 | -9.3 | 2.06 | ||
| 1984 | 674,793 | -94,362 | -12.3 | 1.74 | ||
| 1985 | 655,489 | -19,304 | -2.9 | 1.66 | ||
| 1986 | 636,019 | -19,470 | -3.0 | 1.58 | ||
| 1987 | 623,831 | -12,188 | -1.9 | 1.53 | ||
| 노태우 | 1988 | 633,092 | 9,261 | 1.5 | 1.55 | |
| 1989 | 639,431 | 6,339 | 1.0 | 1.56 | ||
| 1990 | 649,738 | 10,307 | 1.6 | 1.57 | ||
| 1991 | 709,275 | 59,537 | 9.2 | 1.71 | ||
| 1992 | 730,678 | 21,403 | 3.0 | 1.76 | ||
| 김영삼 | 1993 | 715,826 | -14,852 | -2.0 | 1.65 | |
| 1994 | 721,185 | 5,359 | 0.7 | 1.66 | ||
| 1995 | 715,020 | -6,165 | -0.9 | 1.63 | ||
| 1996 | 691,226 | -23,794 | -3.3 | 1.57 | ||
| 1997 | 675,394 | -15,832 | -2.3 | 1.54 | ||
| 김대중 | 1998 | 641,594 | -33,800 | -5.0 | 1.46 | |
| 1999 | 620,668 | -20,926 | -3.3 | 1.43 | ||
| 2000 | 640,089 | 19,421 | 3.1 | 1.48 | ||
| 2001 | 559,934 | -80,155 | -12.5 | 1.31 | ||
| 2002 | 496,911 | -63,023 | -11.3 | 1.18 | ||
| 노무현 | 2003 | 495,036 | -1,875 | -0.4 | 1.19 | |
| 2004 | 476,958 | -18,078 | -3.7 | 1.16 | ||
| 2005 | 438,707 | -38,251 | -8.0 | 1.09 | ||
| 2006 | 451,759 | 13,052 | 3.0 | 1.13 | ||
| 2007 | 496,822 | 45,063 | 10.0 | 1.26 | ||
| 이명박 | 2008 | 465,892 | -30,930 | -6.2 | 1.19 | |
| 2009 | 444,849 | -21,043 | -4.5 | 1.15 | ||
| 2010 | 470,171 | 25,322 | 5.7 | 1.23 | ||
| 2011 | 471,265 | 1,094 | 0.2 | 1.24 | ||
| 2012 | 484,550 | 13,285 | 2.8 | 1.30 | ||
| 박근혜 | 2013 | 436,455 | -48,095 | -9.9 | 1.19 | |
| 2014 | 435,435 | -1,020 | -0.2 | 1.21 | ||
| 2015 | 438,420 | 2,985 | 0.7 | 1.24 | ||
| 2016 | 406,243 | -32,177 | -7.3 | 1.17 | ||
| 문재인 | 2017 | 357,771 | -48,472 | -11.9 | 1.05 | |
| 2018 | 326,822 | -30,949 | -8.7 | 0.98 | ||
| 2019 | 302,676 | -24,146 | -7.4 | 0.92 | ||
| 2020 | 272,337 | -30,339 | -10.0 | 0.84 | ||
| 2021 | 260,562 | -11,775 | -4.3 | 0.81 | ||
| 윤석열 | 2022 | 249,186 | -11,376 | -4.4 | 0.78 | |
| 2023E | 229,340 | -19,846 | -8.0 | 0.73 | 235,039* | |
| 2024 | ||||||
| 2025 | ||||||
| 2026 | ||||||
자료: 통계청, 행정안전부 주민등록 인구통계
주: 1) 대통령 임기는 해당 연도末 기준
2) 2023E는 本紙 추정치
3) * 행정안전부 주민등록 인구통계
이하, ‘1인 대기업(원제는 챗GPT가 몰고 올 변화, 1인 대기업)’에 수록된 출산율 관련 글 하나를 그대로 옮겨본다.
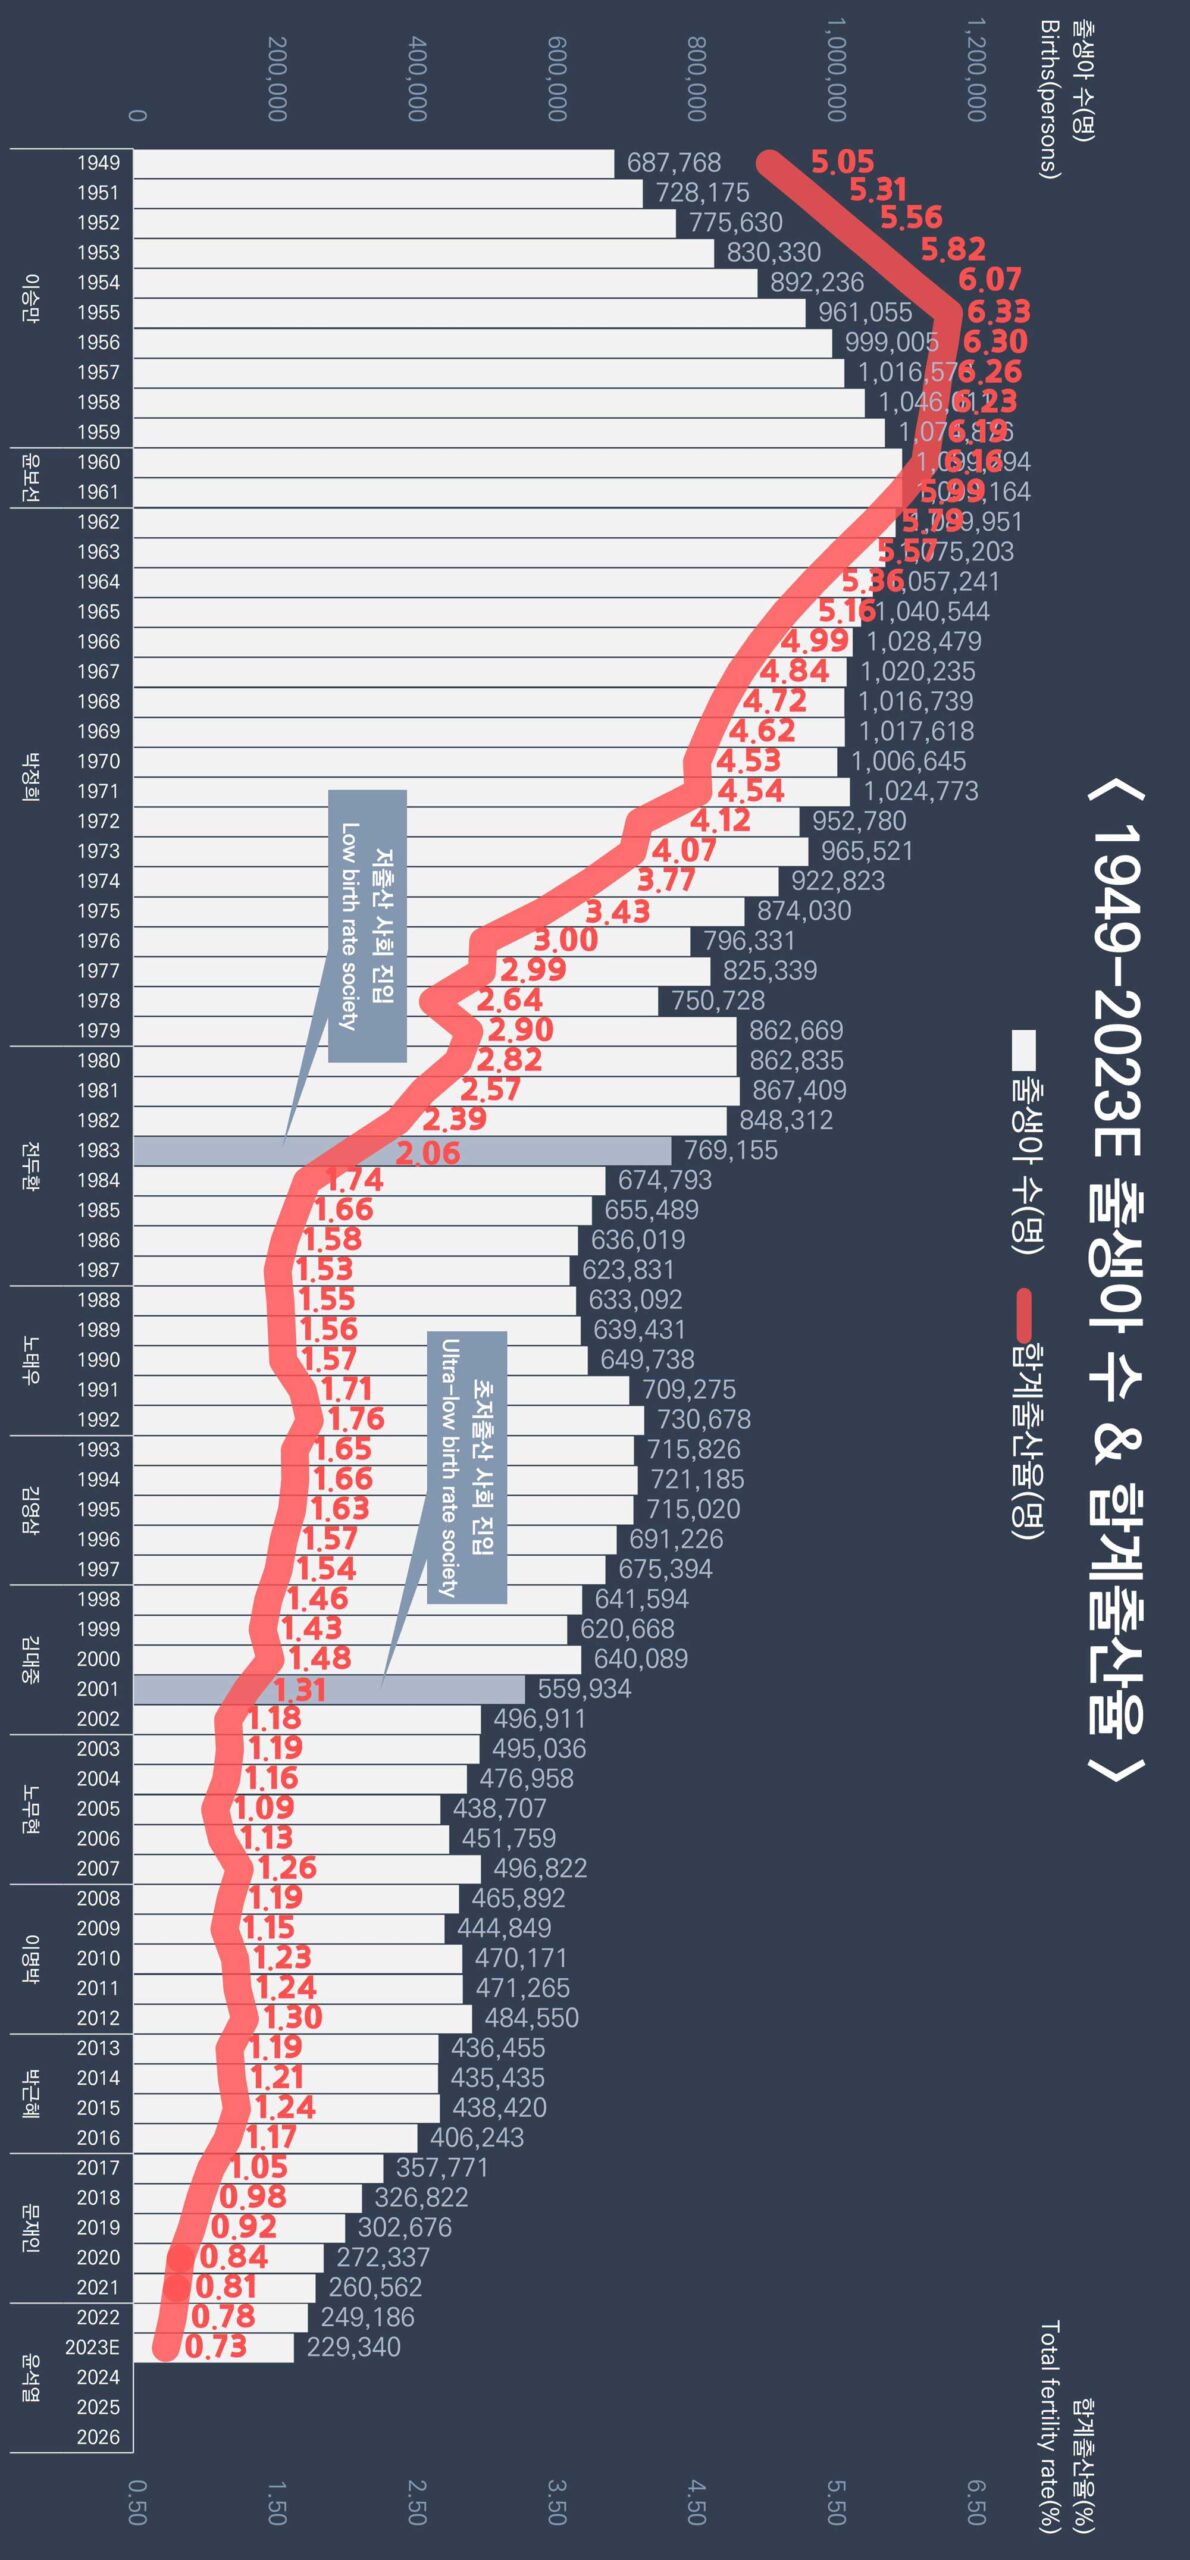
그래프 2. 연도별 출생아 수 및 합계출산율 추이(단위: 명, %) – 세로형
자료: 통계청, 행정안전부 주민등록 인구통계
주: 1) 대통령 임기는 해당 연도末 기준
2) 2023E는 本紙 추정치(아래 표 1에 ‘행정안전부 주민등록 인구통계’上 출생아 수 추가)
English version>>
Reporter’s Note: Falling Birth Rate, What on earth are the Incompetent Governments and National Assembly doing?
(Reporter’s Note) The birth rate is falling even at this moment when the government and the National Assembly are unable to present effective alternatives to rebound the our birth rate.
Why can’t the birth rate rebound despite wasting an astronomical amount of tax money?
Even though the country has entered the stage of extinction, everyone is only pursuing immediate profits.
All over the country, people are constantly lighting meaningless matches. The budget is being wasted without meaning.
The government and the National Assembly are still focused on political strife and property speculation, even though these methods are not working and the country’s major systems, including households, businesses, the national economy, education, and defense, are collapsing.
If this continues, it seems like our country, the Republic of Korea, will soon disappear from the earth.


